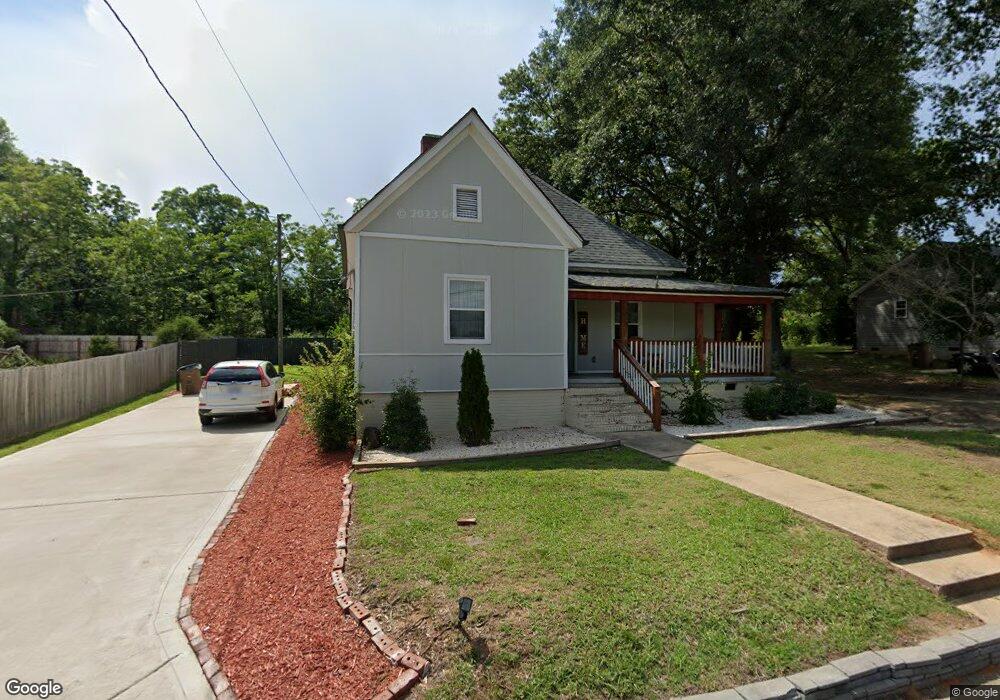
1020 S Morgan St Shelby, NC 28152
Estimated Value: $156,957 - $204,000
--
Bed
--
Bath
987
Sq Ft
$181/Sq Ft
Est. Value
About This Home
This home is located at 1020 S Morgan St, Shelby, NC 28152 and is currently estimated at $178,239, approximately $180 per square foot. 1020 S Morgan St is a home located in Cleveland County with nearby schools including James Love Elementary School, Shelby Middle School, and Shelby High School.
Ownership History
Date
Name
Owned For
Owner Type
Purchase Details
Closed on
Dec 22, 2021
Sold by
Harter Michael Jay Victor
Bought by
Sigmon Misty D and Sigmon Josh
Current Estimated Value
Home Financials for this Owner
Home Financials are based on the most recent Mortgage that was taken out on this home.
Original Mortgage
$161,616
Outstanding Balance
$148,644
Interest Rate
3.11%
Mortgage Type
New Conventional
Estimated Equity
$29,595
Purchase Details
Closed on
Jun 12, 2020
Sold by
Ryans Real Estate Group Llc
Bought by
Harter Michael Jay Victor
Home Financials for this Owner
Home Financials are based on the most recent Mortgage that was taken out on this home.
Original Mortgage
$128,040
Interest Rate
3.2%
Mortgage Type
New Conventional
Purchase Details
Closed on
Dec 31, 2019
Sold by
Byers Stevie Wayne
Bought by
Black Ryan
Create a Home Valuation Report for This Property
The Home Valuation Report is an in-depth analysis detailing your home's value as well as a comparison with similar homes in the area
Home Values in the Area
Average Home Value in this Area
Purchase History
| Date | Buyer | Sale Price | Title Company |
|---|---|---|---|
| Sigmon Misty D | $156,000 | None Available | |
| Harter Michael Jay Victor | $132,000 | None Available | |
| Black Ryan | $20,000 | None Available |
Source: Public Records
Mortgage History
| Date | Status | Borrower | Loan Amount |
|---|---|---|---|
| Open | Sigmon Misty D | $161,616 | |
| Previous Owner | Harter Michael Jay Victor | $128,040 |
Source: Public Records
Tax History Compared to Growth
Tax History
| Year | Tax Paid | Tax Assessment Tax Assessment Total Assessment is a certain percentage of the fair market value that is determined by local assessors to be the total taxable value of land and additions on the property. | Land | Improvement |
|---|---|---|---|---|
| 2025 | $1,545 | $155,307 | $10,462 | $144,845 |
| 2024 | $567 | $44,972 | $8,370 | $36,602 |
| 2023 | $564 | $44,972 | $8,370 | $36,602 |
| 2022 | $564 | $44,972 | $8,370 | $36,602 |
| 2021 | $567 | $44,972 | $8,370 | $36,602 |
| 2020 | $273 | $20,222 | $7,616 | $12,606 |
| 2019 | $273 | $20,222 | $7,616 | $12,606 |
| 2018 | $272 | $20,222 | $7,616 | $12,606 |
| 2017 | $266 | $20,222 | $7,616 | $12,606 |
| 2016 | $265 | $20,222 | $7,616 | $12,606 |
| 2015 | $247 | $19,786 | $7,030 | $12,756 |
| 2014 | $247 | $19,786 | $7,030 | $12,756 |
Source: Public Records
Map
Nearby Homes
- 108 Shull St
- 1201 S Lafayette St
- 203 Putnam St
- 1205 S Lafayette St
- 207 Putnam St
- 118 Broad St
- 1111 S Washington St
- 211 Putnam St
- 128 Pine St
- 1104 Silver St
- 1122 Bridges St
- 000 S Dekalb St
- 214 Morrison St
- 1008 Wilmouth St
- 303 Putnam St
- 1241 S Lafayette St
- 219 Alden Ct
- 719 Smith S
- 515 Broad St
- 624 S Washington St
- 1020 Railroad Ave
- 1024 S Morgan St
- 1024 Railroad Ave
- 1016 Railroad Ave
- 1016 S Morgan St
- 1014 S Morgan St
- 1101 S Lafayette St
- 102 Ella St
- 1103 S Lafayette St
- 1023 S Lafayette St
- 1102 S Morgan St
- 1100 S Lafayette St
- 106 Ella St
- 1042 S Lafayette St
- 1105 S Lafayette St
- 1104 S Morgan St
- 1108 Railroad Ave
- 1101 S Morgan St
- 1007 S Lafayette St
- 108 Ella St