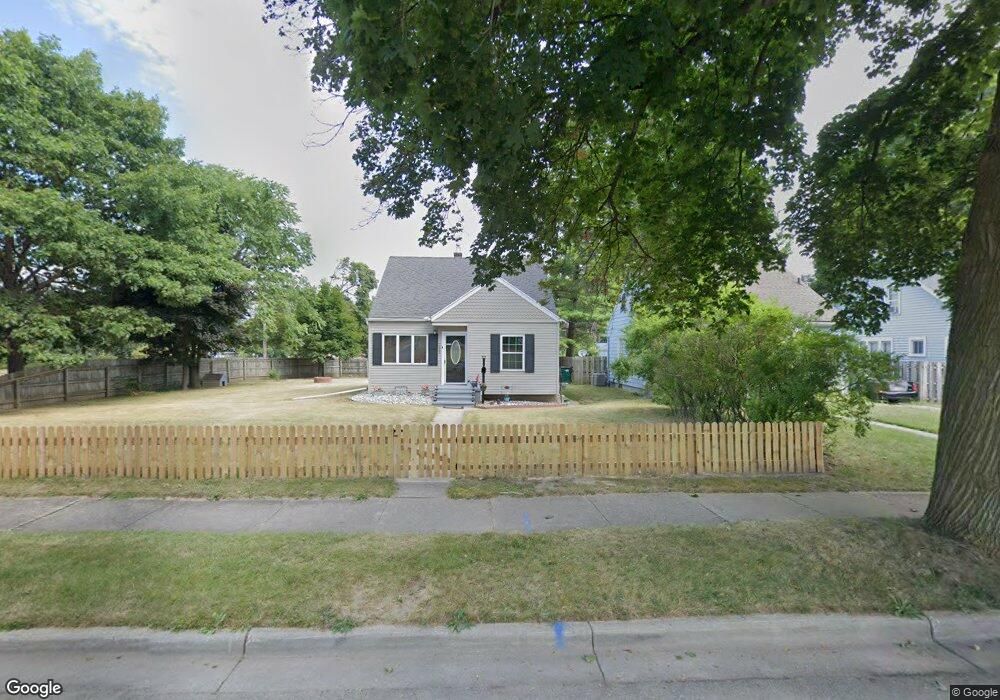
1020 Sparrow Ave Lansing, MI 48910
Moores Park NeighborhoodEstimated Value: $150,000 - $157,000
3
Beds
1
Bath
1,000
Sq Ft
$154/Sq Ft
Est. Value
About This Home
This home is located at 1020 Sparrow Ave, Lansing, MI 48910 and is currently estimated at $153,952, approximately $153 per square foot. 1020 Sparrow Ave is a home located in Ingham County with nearby schools including Averill Elementary School, Pattengill Academy, and J.W. Sexton High School.
Ownership History
Date
Name
Owned For
Owner Type
Purchase Details
Closed on
Oct 29, 2025
Sold by
Smythe Gary L and Smythe Jamison
Bought by
Smythe Jamison
Current Estimated Value
Purchase Details
Closed on
Jan 31, 2008
Sold by
Helton Jeremy S
Bought by
Hsbc Bank Usa Na and First Nlc Trust 2007-1 Mortgage Backed C
Purchase Details
Closed on
Sep 6, 2007
Sold by
Helton Jeremy S
Bought by
Hsbc Bank Usa Na and First Nlc Trust 2007-1 Mortgage Backed C
Purchase Details
Closed on
Oct 17, 2003
Sold by
Simpson Timothy A
Bought by
Birch Douglas
Home Financials for this Owner
Home Financials are based on the most recent Mortgage that was taken out on this home.
Original Mortgage
$91,500
Interest Rate
8%
Mortgage Type
Purchase Money Mortgage
Purchase Details
Closed on
Feb 8, 2001
Sold by
Jewell Scott A and Jewell Mary L
Bought by
Simpson Timothy A
Home Financials for this Owner
Home Financials are based on the most recent Mortgage that was taken out on this home.
Original Mortgage
$68,411
Interest Rate
7.1%
Mortgage Type
FHA
Create a Home Valuation Report for This Property
The Home Valuation Report is an in-depth analysis detailing your home's value as well as a comparison with similar homes in the area
Home Values in the Area
Average Home Value in this Area
Purchase History
| Date | Buyer | Sale Price | Title Company |
|---|---|---|---|
| Smythe Jamison | -- | None Listed On Document | |
| Hsbc Bank Usa Na | $109,853 | None Available | |
| Hsbc Bank Usa Na | $102,821 | None Available | |
| Birch Douglas | $91,500 | Trans | |
| Simpson Timothy A | $69,000 | -- |
Source: Public Records
Mortgage History
| Date | Status | Borrower | Loan Amount |
|---|---|---|---|
| Previous Owner | Birch Douglas | $91,500 | |
| Previous Owner | Simpson Timothy A | $68,411 |
Source: Public Records
Tax History Compared to Growth
Tax History
| Year | Tax Paid | Tax Assessment Tax Assessment Total Assessment is a certain percentage of the fair market value that is determined by local assessors to be the total taxable value of land and additions on the property. | Land | Improvement |
|---|---|---|---|---|
| 2025 | $2,345 | $56,200 | $7,800 | $48,400 |
| 2024 | $18 | $51,700 | $7,800 | $43,900 |
| 2023 | $2,200 | $46,900 | $7,800 | $39,100 |
| 2022 | $1,985 | $38,900 | $8,000 | $30,900 |
| 2021 | $1,944 | $36,400 | $7,000 | $29,400 |
| 2020 | $1,932 | $35,100 | $7,000 | $28,100 |
| 2019 | $1,891 | $33,300 | $7,000 | $26,300 |
| 2018 | $1,736 | $32,200 | $7,000 | $25,200 |
| 2017 | $1,661 | $32,200 | $7,000 | $25,200 |
| 2016 | $1,591 | $29,300 | $7,000 | $22,300 |
| 2015 | $1,591 | $28,200 | $14,085 | $14,115 |
| 2014 | $1,591 | $27,800 | $16,942 | $10,858 |
Source: Public Records
Map
Nearby Homes
- 1010 W Barnes Ave
- 1120 Alsdorf St
- 917 W Barnes Ave
- 1721 Fletcher St
- 1309 Hammond St
- 1116 George St
- 1221 Moores River Dr
- 1114 Goodrich St
- 1315 Goodrich St
- 1312 W Mount Hope Ave
- 1913 Stirling Ave
- 907 Lenore Ave
- 1723 Osband Ave
- 1516 Moores River Dr
- 712 Lenore Ave
- 1836 Osband Ave
- 2112 Stirling Ave
- 2118 Marion Ave
- 1420 Poxson Ave
- 511 W Mount Hope Ave
- 1024 Sparrow Ave
- 1014 Sparrow Ave
- 1010 Sparrow Ave
- 1008 Sparrow Ave
- 1021 Britten Ave
- 1017 Britten Ave
- 1013 Britten Ave
- 1027 Britten Ave
- 1000 Sparrow Ave
- 1009 Britten Ave
- 1005 Britten Ave
- 1001 Britten Ave
- 920 Sparrow Ave
- 917 Sparrow Ave
- 1020 Britten Ave
- 1016 Britten Ave
- 1024 Britten Ave
- 915 Sparrow Ave
- 921 Britten Ave