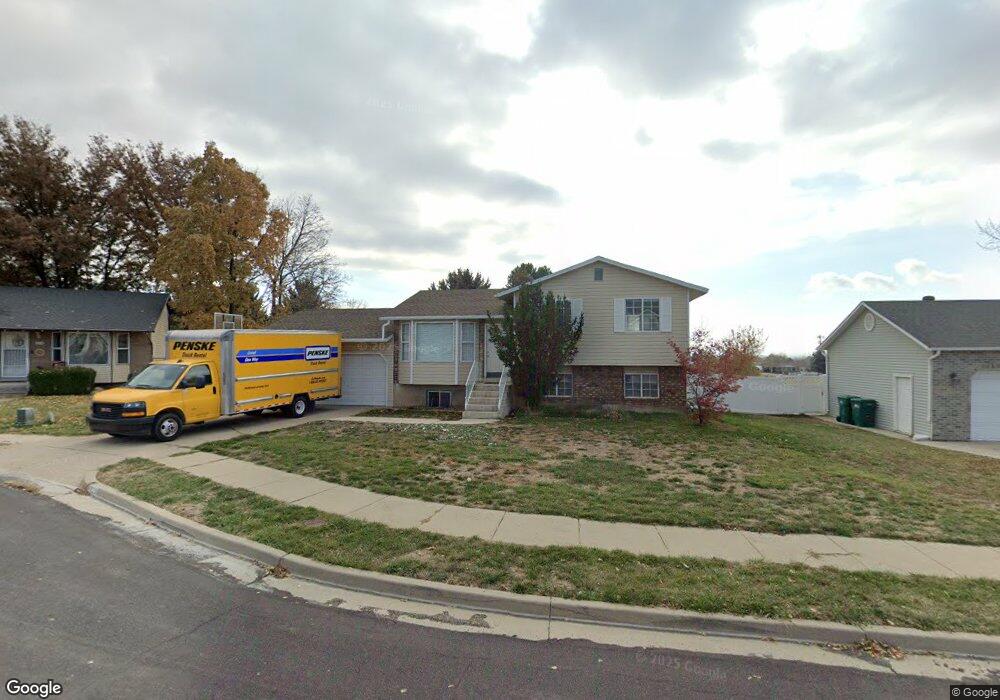
1020 Springtree Dr Layton, UT 84040
Estimated Value: $460,000 - $535,000
5
Beds
2
Baths
1,020
Sq Ft
$492/Sq Ft
Est. Value
About This Home
This home is located at 1020 Springtree Dr, Layton, UT 84040 and is currently estimated at $501,711, approximately $491 per square foot. 1020 Springtree Dr is a home located in Davis County with nearby schools including King Elementary School, Central Davis Junior High School, and Layton High School.
Ownership History
Date
Name
Owned For
Owner Type
Purchase Details
Closed on
Nov 20, 2020
Sold by
Brown Harold G
Bought by
Davidson Josh
Current Estimated Value
Home Financials for this Owner
Home Financials are based on the most recent Mortgage that was taken out on this home.
Original Mortgage
$308,750
Outstanding Balance
$274,744
Interest Rate
2.8%
Mortgage Type
New Conventional
Estimated Equity
$226,967
Purchase Details
Closed on
Aug 27, 2019
Sold by
G P Investments Llc
Bought by
Brown Harold G
Purchase Details
Closed on
Mar 3, 2009
Sold by
G-P Investments Llc
Bought by
G P Investments Llc
Purchase Details
Closed on
Feb 10, 2009
Sold by
Brown Harold G and Brown Jolyn
Bought by
G P Llc
Purchase Details
Closed on
Dec 20, 2001
Sold by
Hunt Kenneth N and Hunt Lisa G
Bought by
Brown Harold G and Brown Jolyn
Home Financials for this Owner
Home Financials are based on the most recent Mortgage that was taken out on this home.
Original Mortgage
$131,048
Interest Rate
6.39%
Create a Home Valuation Report for This Property
The Home Valuation Report is an in-depth analysis detailing your home's value as well as a comparison with similar homes in the area
Home Values in the Area
Average Home Value in this Area
Purchase History
| Date | Buyer | Sale Price | Title Company |
|---|---|---|---|
| Davidson Josh | -- | Meridian Title Company | |
| Brown Harold G | -- | None Available | |
| G P Investments Llc | -- | None Available | |
| G P Llc | -- | None Available | |
| Brown Harold G | -- | Us Title |
Source: Public Records
Mortgage History
| Date | Status | Borrower | Loan Amount |
|---|---|---|---|
| Open | Davidson Josh | $308,750 | |
| Previous Owner | Brown Harold G | $131,048 |
Source: Public Records
Tax History
| Year | Tax Paid | Tax Assessment Tax Assessment Total Assessment is a certain percentage of the fair market value that is determined by local assessors to be the total taxable value of land and additions on the property. | Land | Improvement |
|---|---|---|---|---|
| 2025 | $4,087 | $429,000 | $220,001 | $208,999 |
| 2024 | $2,159 | $228,249 | $145,426 | $82,823 |
| 2023 | $2,119 | $395,000 | $197,425 | $197,575 |
| 2022 | $2,228 | $225,500 | $105,780 | $119,720 |
| 2021 | $2,074 | $313,000 | $160,798 | $152,202 |
| 2020 | $1,809 | $262,000 | $129,449 | $132,551 |
| 2019 | $1,784 | $253,000 | $115,799 | $137,201 |
| 2018 | $1,622 | $231,000 | $89,564 | $141,436 |
| 2016 | $1,396 | $102,575 | $47,263 | $55,312 |
| 2015 | $1,338 | $93,335 | $47,263 | $46,072 |
| 2014 | $1,185 | $84,460 | $47,263 | $37,197 |
| 2013 | -- | $89,252 | $22,748 | $66,504 |
Source: Public Records
Map
Nearby Homes
- 1048 E Cherry Ln
- 1033 E 825 N
- 997 E 825 N
- 1252 E Larkspur Way
- 1340 E Hollyhock Way
- 1266 E Larkspur Way
- Richards Plan at Eastridge Park - The Vistas
- Brynlee Plan at Eastridge Park - The Vistas
- Ontario Plan at Eastridge Park - The Heights
- Mclauren Plan at Eastridge Park - The Vistas
- Escher Plan at Eastridge Park - The Vistas
- Hawthorne Plan at Eastridge Park - The Vistas
- Caulfield Plan at Eastridge Park - The Vistas
- Bromley Plan at Eastridge Park - The Heights
- Beringwood Plan at Eastridge Park - The Heights
- Kimbrough Plan at Eastridge Park - The Vistas
- 1305 E Larkspur Way
- 1156 Cherrywood Dr
- 540 E Quail Ln N
- 806 Valeria Dr
- 1020 E 1275 N
- 1006 Springtree Dr
- 1034 Springtree Dr
- 1278 N 1000 E
- 1242 N Fairfield Rd
- 1291 N 1000 E
- 986 Springtree Dr
- 986 E 1275 N
- 1001 Springtree Dr
- 1294 N 1000 E
- 1267 N 1100 E
- 1267 Kimberly Dr
- 1253 N 1100 E
- 1253 Kimberly Dr
- 1311 N 1000 E
- 985 E 1275 N
- 1297 Kimberly Dr
- 978 Springtree Dr
- 985 Springtree Dr
- 1297 N 1100 E
Your Personal Tour Guide
Ask me questions while you tour the home.