
1020 W Allen St Bloomington, IN 47403
Estimated payment $9,108/month
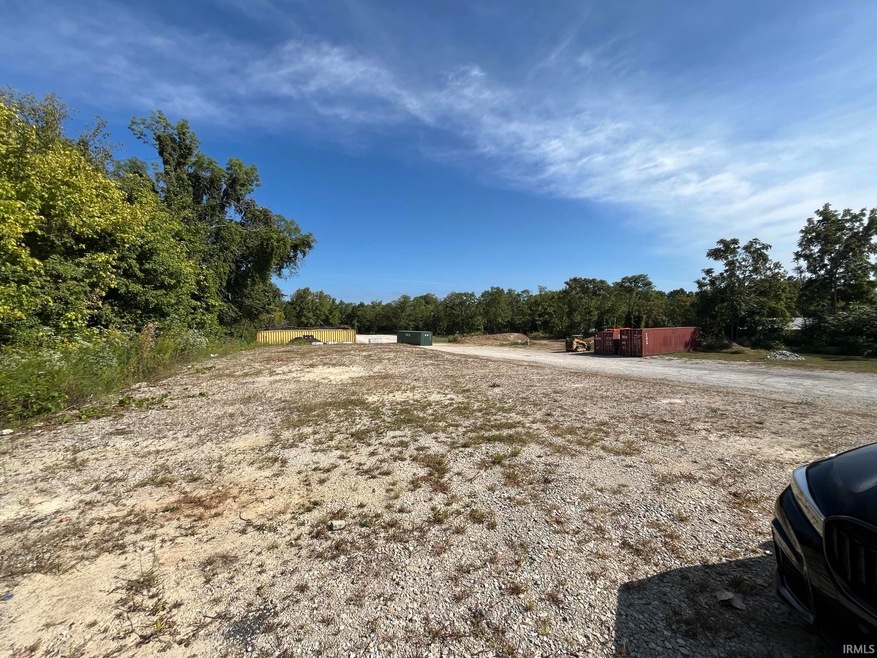
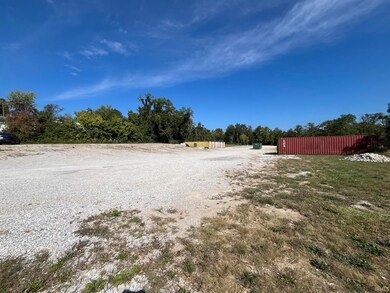
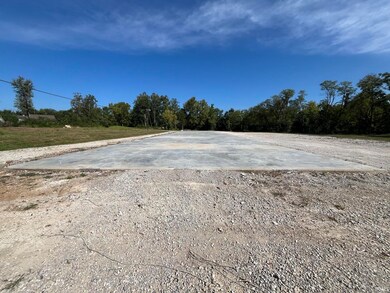
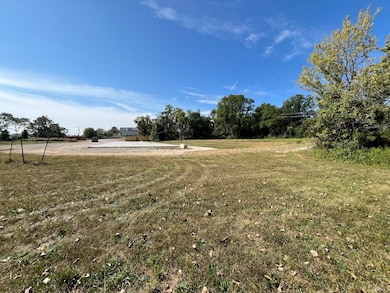
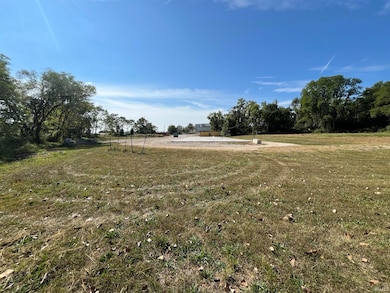
About This Lot
Great Vacant lot with a 42' X 200' concrete pad. Located near Downtown Bloomington and across from Catalent Pharma Solutions
Listing Agent
FC Tucker/Bloomington REALTORS Brokerage Email: chris@cockerham.us Listed on: 10/15/2025

Property Details
Property Type
- Land
Est. Annual Taxes
- $16,480
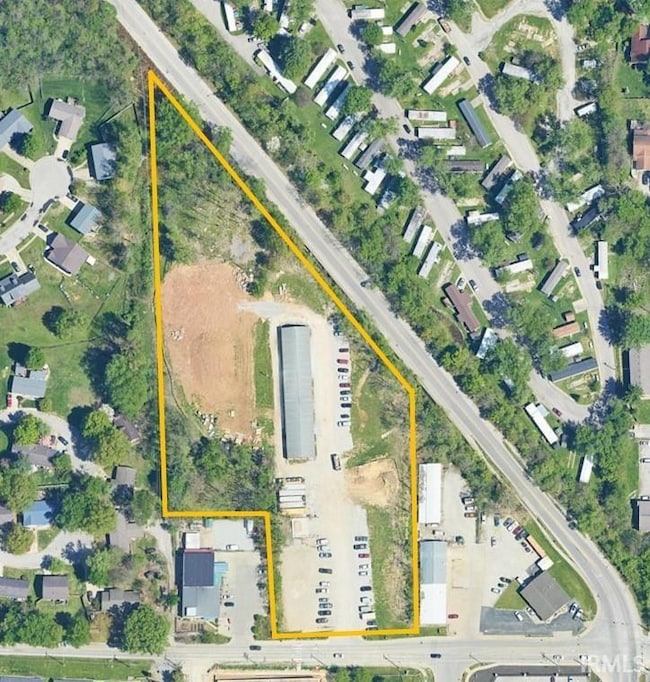
Lot Details
- 4.53 Acre Lot
- Finished Lot(s)
- Property is zoned ME - Mixed-Use Employment
Parking
- Gravel Driveway
Schools
- Templeton Elementary School
- Jackson Creek Middle School
- Bloomington South High School
Additional Features
- Property is near a railroad
- Heating System Uses Gas
Listing and Financial Details
- Assessor Parcel Number 53-08-05-400-010.000-009
Map
Home Values in the Area
Average Home Value in this Area
Tax History
| Year | Tax Paid | Tax Assessment Tax Assessment Total Assessment is a certain percentage of the fair market value that is determined by local assessors to be the total taxable value of land and additions on the property. | Land | Improvement |
|---|---|---|---|---|
| 2024 | $24,699 | $805,000 | $521,000 | $284,000 |
| 2023 | $7,472 | $706,200 | $521,000 | $185,200 |
| 2022 | $14,422 | $712,300 | $521,000 | $191,300 |
| 2021 | $9,910 | $478,100 | $373,600 | $104,500 |
| 2020 | $9,882 | $504,300 | $373,600 | $130,700 |
| 2019 | $9,190 | $435,100 | $373,600 | $61,500 |
| 2018 | $9,240 | $435,100 | $373,600 | $61,500 |
| 2017 | $9,176 | $432,400 | $373,600 | $58,800 |
| 2016 | $9,041 | $435,600 | $373,600 | $62,000 |
| 2014 | $4,112 | $197,500 | $138,000 | $59,500 |
Property History
| Date | Event | Price | List to Sale | Price per Sq Ft |
|---|---|---|---|---|
| 10/15/2025 10/15/25 | For Sale | $1,475,000 | -- | -- |
Purchase History
| Date | Type | Sale Price | Title Company |
|---|---|---|---|
| Warranty Deed | -- | None Available |
Mortgage History
| Date | Status | Loan Amount | Loan Type |
|---|---|---|---|
| Open | $580,000 | Purchase Money Mortgage |
Source: Indiana Regional MLS
MLS Number: 202541764
APN: 53-08-05-400-010.000-009
Disclaimer: Certain information contained herein is derived from information provided by parties other than Homes.com. All information provided is deemed reliable, but is not guaranteed to be accurate and should be independently verified.
![]() IDX information is provided exclusively for personal, non-commercial use, and may not be used for any purpose other than to identify prospective properties consumers may be interested in purchasing. Information is deemed reliable but not guaranteed.
IDX information is provided exclusively for personal, non-commercial use, and may not be used for any purpose other than to identify prospective properties consumers may be interested in purchasing. Information is deemed reliable but not guaranteed.
- 1201 W Allen St
- 1221 W Green Tree Ln
- 717 W Allen St
- 1375 W Allen Unit F2 St Unit F2
- 614 W Dixie St
- 827 W 1st St
- 825 W 1st St
- 515 W Allen St
- 1100 S Rogers St
- 925 W 2nd St
- 1112 S Madison St
- 808 W 2nd St
- 1209 S Madison St
- 601 W Howe St
- 700 S College Ave
- 405 W Hillside Dr
- 339 S Fairview St
- 1006 S Walnut St
- 750 S Walnut St
- 542 S Walnut St
- 1105 S Rogers St Unit A
- 1101 S Rogers St
- 1101 S Rogers St
- 1101 S Rogers St
- 327-329 W 1st St
- 909 S Morton St
- 819 S Morton St
- 525 S Patterson Dr
- 421 S Madison St Unit 421 S Madison
- 1521 Isaac Dr
- 532 S Walnut St
- 222 S Rogers St
- 809 S Washington St
- 718 S Lincoln St
- 1208 S Lincoln St
- 620 S Lincoln St
- 905 S Lincoln St
- 901 S Lincoln St Unit 1
- 413-429 S Walnut St
- 722 W Kirkwood Ave Unit 722