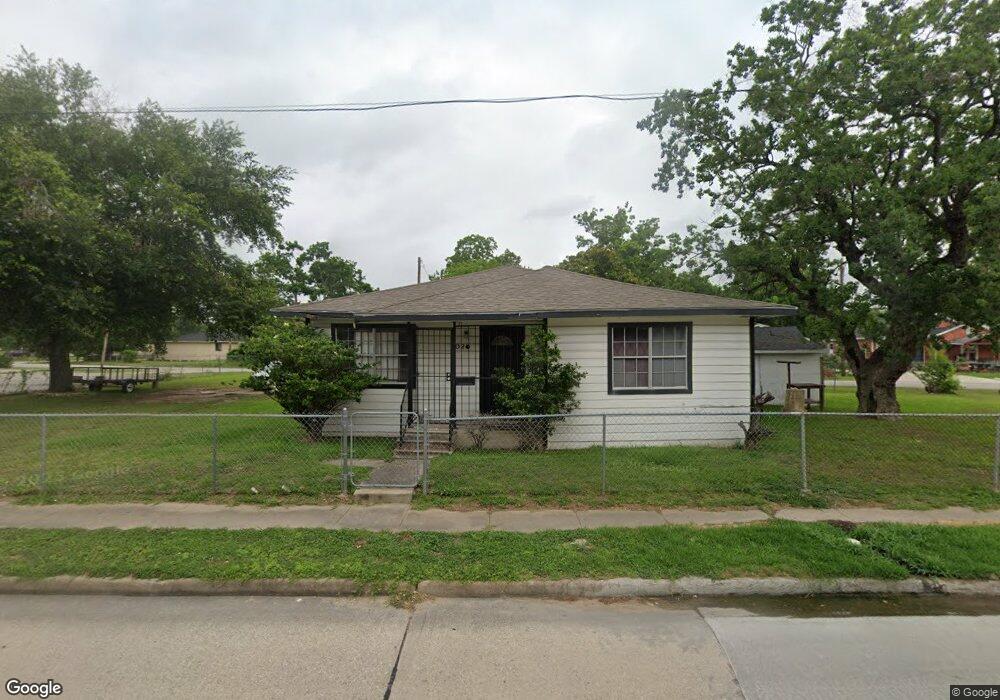
1020 W Little York Rd Houston, TX 77091
Acres Homes NeighborhoodEstimated Value: $208,484 - $241,000
4
Beds
2
Baths
1,528
Sq Ft
$145/Sq Ft
Est. Value
About This Home
This home is located at 1020 W Little York Rd, Houston, TX 77091 and is currently estimated at $221,371, approximately $144 per square foot. 1020 W Little York Rd is a home located in Harris County with nearby schools including Wesley Elementary School, Williams Middle, and Booker T Washington Sr High.
Ownership History
Date
Name
Owned For
Owner Type
Purchase Details
Closed on
Sep 11, 1996
Sold by
Snell Simon
Bought by
Jones Mark K and Jones Marcus D
Current Estimated Value
Purchase Details
Closed on
Dec 26, 1994
Sold by
Jones Johnnie
Bought by
Jones Mark
Purchase Details
Closed on
Oct 20, 1994
Sold by
Hudspeth Robert and Hudspeth Rhoda
Bought by
Jones Mark and Jones Marcus
Create a Home Valuation Report for This Property
The Home Valuation Report is an in-depth analysis detailing your home's value as well as a comparison with similar homes in the area
Home Values in the Area
Average Home Value in this Area
Purchase History
| Date | Buyer | Sale Price | Title Company |
|---|---|---|---|
| Jones Mark K | -- | -- | |
| Jones Mark | -- | -- | |
| Jones Mark | -- | -- |
Source: Public Records
Tax History Compared to Growth
Tax History
| Year | Tax Paid | Tax Assessment Tax Assessment Total Assessment is a certain percentage of the fair market value that is determined by local assessors to be the total taxable value of land and additions on the property. | Land | Improvement |
|---|---|---|---|---|
| 2025 | $3,459 | $164,148 | $116,551 | $47,597 |
| 2024 | $3,459 | $165,332 | $116,551 | $48,781 |
| 2023 | $3,409 | $169,219 | $116,551 | $52,668 |
| 2022 | $2,851 | $129,479 | $88,200 | $41,279 |
| 2021 | $2,252 | $96,633 | $53,551 | $43,082 |
| 2020 | $2,180 | $90,021 | $47,251 | $42,770 |
| 2019 | $1,450 | $57,286 | $16,380 | $40,906 |
| 2018 | $1,413 | $55,822 | $16,380 | $39,442 |
| 2017 | $1,310 | $51,826 | $12,600 | $39,226 |
| 2016 | $1,310 | $51,826 | $12,600 | $39,226 |
| 2015 | $990 | $38,500 | $12,600 | $25,900 |
| 2014 | $990 | $38,500 | $12,600 | $25,900 |
Source: Public Records
Map
Nearby Homes
- 1051 W Little York Rd
- 1025 Glen Ave
- 1060 W Little York Rd
- 1047 Glenn Ave
- 1053 Glenn Ave
- 6822 Tuskegee St
- 7014 W Montgomery Rd
- 1029 Dolly Wright St
- 922 W Little York Rd
- 924 W Little York Rd
- 7422 Mount St
- 6726 W Montgomery Rd
- 6729 Arabella St
- 7303 Wheatley St
- 7229 Wheatley St
- 899 W Little York Rd
- 6733 Cohn St
- 6718 Utah St
- 6727 Utah St
- 6723 Cohn St
- 972 Calvin Ave
- 978 Calvin Ave
- 970 Calvin Ave
- 968 Calvin Ave
- 982 Calvin Ave
- 0 N Mount St N Unit 78677506
- 0 N Mount St N Unit 56686273
- 960 Calvin Ave
- 7438 Mount St
- 7036 Mount St
- 998 Calvin Ave
- 955 Green Meadow Ln
- 7105 Mount St
- 1039 W Little York Rd
- 7031 Mount St
- 951 Green Meadow Ln
- 1042 W Little York Rd
- 7032 Mount St
- 983 Glen Ave
- 987 Glen Ave