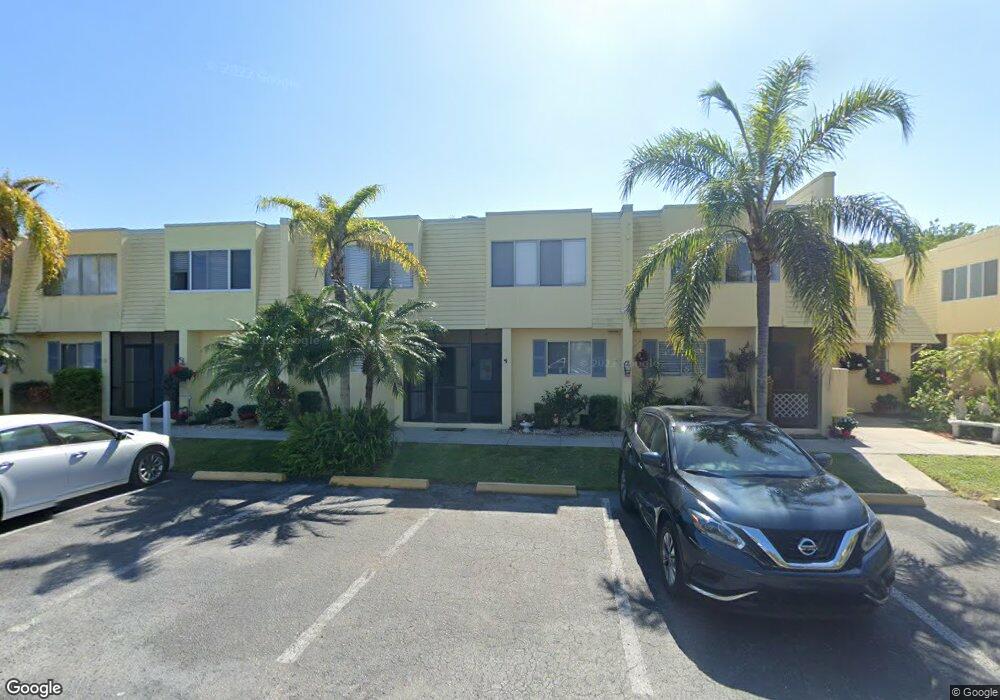
1020 W Marion Ave Unit 47 Punta Gorda, FL 33950
Central Punta Gorda NeighborhoodEstimated Value: $142,000 - $251,000
2
Beds
2
Baths
999
Sq Ft
$205/Sq Ft
Est. Value
About This Home
This home is located at 1020 W Marion Ave Unit 47, Punta Gorda, FL 33950 and is currently estimated at $205,047, approximately $205 per square foot. 1020 W Marion Ave Unit 47 is a home located in Charlotte County with nearby schools including Sallie Jones Elementary School, Punta Gorda Middle School, and Charlotte High School.
Ownership History
Date
Name
Owned For
Owner Type
Purchase Details
Closed on
Nov 3, 2022
Sold by
Wagar Richard D and Wagar Linda M
Bought by
Wagar Linda M and Ohara Clair
Current Estimated Value
Purchase Details
Closed on
Jun 23, 2022
Sold by
Wagar Richard D and Wagar Linda M
Bought by
Ohara Clair
Purchase Details
Closed on
Jul 24, 2018
Sold by
Carr Paul J and Aguiar Yvette M
Bought by
Wagar Richard D and Wagar Linda M
Purchase Details
Closed on
Mar 18, 2016
Sold by
Hancock Richard E and Philips Karly A
Bought by
Carr Paul J and Auiar Yvette M
Purchase Details
Closed on
Dec 14, 2012
Sold by
Campbell Leona H and Leona H Campbell Revocable Tru
Bought by
Hancock Richard E and Philips Karly A
Purchase Details
Closed on
Jun 26, 2009
Sold by
Campbell Leona and Campbell Todd E
Bought by
Campbell Leona H and Leona H Campbell Revocable Trust
Purchase Details
Closed on
Oct 16, 2001
Sold by
Tucker Diana
Bought by
Campbell Leona and Campbell Todd E
Create a Home Valuation Report for This Property
The Home Valuation Report is an in-depth analysis detailing your home's value as well as a comparison with similar homes in the area
Home Values in the Area
Average Home Value in this Area
Purchase History
| Date | Buyer | Sale Price | Title Company |
|---|---|---|---|
| Wagar Linda M | $100 | -- | |
| Ohara Clair | -- | Mahshie & Decosta Pa | |
| Wagar Richard D | $128,300 | Attorney | |
| Carr Paul J | $92,000 | Suncoast One Title & Closing | |
| Hancock Richard E | $58,000 | Burnt Store Title & Escrow L | |
| Campbell Leona H | $25,100 | Attorney | |
| Campbell Leona | $56,000 | -- |
Source: Public Records
Tax History Compared to Growth
Tax History
| Year | Tax Paid | Tax Assessment Tax Assessment Total Assessment is a certain percentage of the fair market value that is determined by local assessors to be the total taxable value of land and additions on the property. | Land | Improvement |
|---|---|---|---|---|
| 2023 | $2,131 | $165,584 | $0 | $0 |
| 2022 | $1,630 | $95,105 | $0 | $95,105 |
| 2021 | $1,643 | $93,407 | $0 | $93,407 |
| 2020 | $1,548 | $90,010 | $0 | $90,010 |
| 2019 | $1,831 | $105,295 | $0 | $105,295 |
| 2018 | $1,413 | $88,312 | $0 | $88,312 |
| 2017 | $1,286 | $77,273 | $0 | $0 |
| 2016 | $1,198 | $70,479 | $0 | $0 |
| 2015 | $458 | $53,496 | $0 | $0 |
| 2014 | $463 | $53,550 | $0 | $0 |
Source: Public Records
Map
Nearby Homes
- 1020 W Marion Ave Unit 42
- 1020 W Marion Ave Unit 50
- 1020 W Marion Ave Unit 41
- 217 Shreve St
- 950 W Olympia Ave
- 821 W Marion Ave
- 817 W Marion Ave
- 809 Kings Ct
- 1250 W Marion Ave Unit 323
- 1250 W Marion Ave Unit 341
- 1250 W Marion Ave Unit 122
- 1250 W Marion Ave Unit 3UNIT33
- 1250 W Marion Ave Unit 242
- 121 Dolly St
- 717 W Marion Ave
- 130 Breakers Ct Unit 2UNIT21
- 706 W Marion Ave
- 310 Caicos Dr
- 257 Chasteen #2 St Unit 2
- 702 W Olympia Ave
- 1020 W Marion Ave
- 1020 W Marion Ave Unit 55
- 1020 W Marion Ave Unit 53
- 1020 W Marion Ave Unit 46
- 1020 W Marion Ave Unit 45
- 1020 W Marion Ave Unit 44
- 1020 W Marion Ave Unit 54
- 1020 W Marion Ave Unit 52
- 1020 W Marion Ave Unit 51
- 1020 W Marion Ave Unit 49
- 1020 W Marion Ave Unit 43
- 1020 W Marion Ave Unit 48
- 1031 W Retta Esplanade Unit 114
- 1031 W Retta Esplanade Unit 111
- 1031 W Retta Esplanade Unit 123
- 1031 W Retta Esplanade Unit 131
- 1031 W Retta Esplanade Unit 121
- 1031 W Retta Esplanade Unit 124
- 1031 W Retta Esplanade Unit 113
- 1031 W Retta Esplanade Unit 132