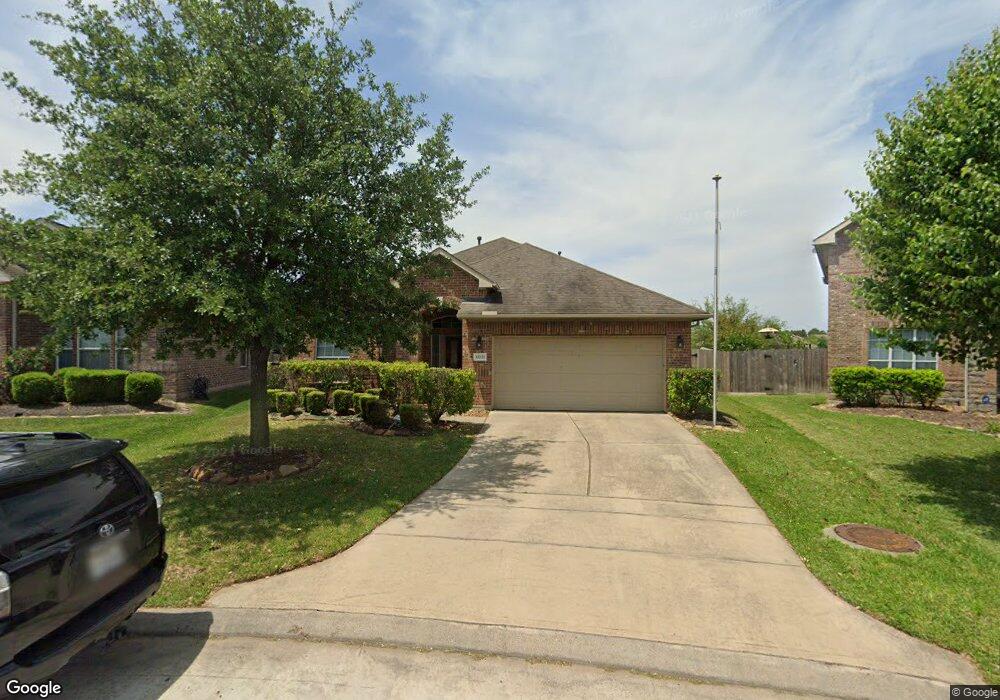
10202 N Pine Ivy Ln Tomball, TX 77375
Hufsmith NeighborhoodEstimated Value: $287,526 - $323,000
3
Beds
2
Baths
1,828
Sq Ft
$167/Sq Ft
Est. Value
About This Home
This home is located at 10202 N Pine Ivy Ln, Tomball, TX 77375 and is currently estimated at $304,382, approximately $166 per square foot. 10202 N Pine Ivy Ln is a home located in Harris County with nearby schools including Mahaffey Elementary School, Klein Oak High School, and Comquest Academy.
Ownership History
Date
Name
Owned For
Owner Type
Purchase Details
Closed on
Nov 12, 2015
Sold by
Bailey James and Bailey Kristi
Bought by
Bush James and Bush Katen
Current Estimated Value
Home Financials for this Owner
Home Financials are based on the most recent Mortgage that was taken out on this home.
Original Mortgage
$188,977
Outstanding Balance
$149,193
Interest Rate
3.9%
Mortgage Type
VA
Estimated Equity
$155,189
Purchase Details
Closed on
Jan 30, 2009
Sold by
Lennar Homes Of Texas
Bought by
Bailey James
Home Financials for this Owner
Home Financials are based on the most recent Mortgage that was taken out on this home.
Original Mortgage
$139,092
Interest Rate
5.17%
Mortgage Type
FHA
Purchase Details
Closed on
Sep 2, 2008
Sold by
170 Dowdell Ltd
Bought by
Lennar Homes Of Texas Land & Const Ltd
Create a Home Valuation Report for This Property
The Home Valuation Report is an in-depth analysis detailing your home's value as well as a comparison with similar homes in the area
Home Values in the Area
Average Home Value in this Area
Purchase History
| Date | Buyer | Sale Price | Title Company |
|---|---|---|---|
| Bush James | -- | None Available | |
| Bailey James | -- | North American Title Company | |
| Lennar Homes Of Texas Sales & Marketing | -- | North American Title Company | |
| Lennar Homes Of Texas Land & Const Ltd | -- | North American Title Company |
Source: Public Records
Mortgage History
| Date | Status | Borrower | Loan Amount |
|---|---|---|---|
| Open | Bush James | $188,977 | |
| Previous Owner | Bailey James | $139,092 |
Source: Public Records
Tax History Compared to Growth
Tax History
| Year | Tax Paid | Tax Assessment Tax Assessment Total Assessment is a certain percentage of the fair market value that is determined by local assessors to be the total taxable value of land and additions on the property. | Land | Improvement |
|---|---|---|---|---|
| 2025 | $3,690 | $288,492 | $50,534 | $237,958 |
| 2024 | $3,690 | $284,010 | $53,825 | $230,185 |
| 2023 | $3,690 | $301,260 | $53,825 | $247,435 |
| 2022 | $7,235 | $268,568 | $53,825 | $214,743 |
| 2021 | $7,053 | $214,553 | $31,399 | $183,154 |
| 2020 | $7,360 | $201,813 | $31,399 | $170,414 |
| 2019 | $7,424 | $198,069 | $31,399 | $166,670 |
| 2018 | $2,163 | $188,280 | $27,810 | $160,470 |
| 2017 | $14,140 | $188,280 | $27,810 | $160,470 |
| 2016 | $6,654 | $181,825 | $27,810 | $154,015 |
| 2015 | $4,838 | $164,129 | $27,810 | $136,319 |
| 2014 | $4,838 | $158,891 | $27,810 | $131,081 |
Source: Public Records
Map
Nearby Homes
- 23618 Plantation Pines Ln
- 23623 Plantation Pines Ln
- 23635 Plantation Pines Ln
- 23719 Plantation Pines Ln
- 23730 Hiddenbriar Loop
- 9923 Berlandier Ash Ln
- 23003 Black Mountain Ash Ct
- 10423 Rochester Hills Ln
- 22911 Banff Brook Way
- 22906 Dale River Rd
- 000 Na
- 22911 Eselle Creek Dr
- 10015 Easterwood Trail
- 24236 Stuebner Airline Rd
- 24402 Deep Meadow Dr
- 10703 Catclaw Ct
- 25706 Boxwood Hedge Ln
- 0 Hufsmith Kohrville Rd Unit 13972653
- 0 Johnson Rd Rd Unit 62402995
- 8718 Kerr Dr -Lot 023
- 23342 E Pine Ivy Ln
- 10206 N Pine Ivy Ln
- 10203 N Pine Ivy Ln
- 10210 N Pine Ivy Ln
- 23338 E Pine Ivy Ln
- 23339 E Pine Ivy Ln
- 23334 E Pine Ivy Ln
- 23402 W Pine Ivy Ln
- 23406 W Pine Ivy Ln
- 23335 E Pine Ivy Ln
- 23410 W Pine Ivy Ln
- 10207 Norway Spruce Ln
- 10211 Norway Spruce Ln
- 23330 E Pine Ivy Ln
- 23338 W Pine Ivy Ln
- 10215 Norway Spruce Ln
- 23331 E Pine Ivy Ln
- 10219 Norway Spruce Ln
- 23334 W Pine Ivy Ln
- 10203 Norway Spruce Ln