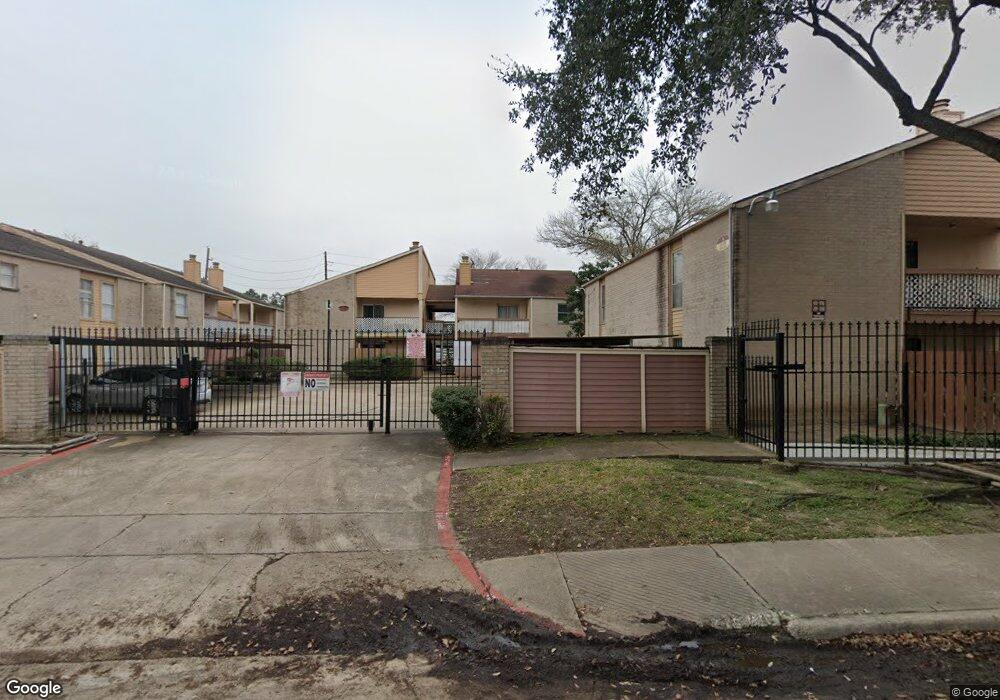
10203 Forum Park Dr Unit 140 Houston, TX 77036
Westwood NeighborhoodEstimated Value: $60,000 - $72,000
2
Beds
2
Baths
961
Sq Ft
$68/Sq Ft
Est. Value
About This Home
This home is located at 10203 Forum Park Dr Unit 140, Houston, TX 77036 and is currently estimated at $65,642, approximately $68 per square foot. 10203 Forum Park Dr Unit 140 is a home located in Harris County with nearby schools including Best Elementary School, Klentzman Intermediate School, and Olle Middle School.
Ownership History
Date
Name
Owned For
Owner Type
Purchase Details
Closed on
Mar 12, 2012
Sold by
Durrani Muhammad Saleem and Durrani Hamayun Jan
Bought by
Lopez Antonio and Lopez Pedro
Current Estimated Value
Home Financials for this Owner
Home Financials are based on the most recent Mortgage that was taken out on this home.
Original Mortgage
$33,900
Outstanding Balance
$23,398
Interest Rate
3.97%
Mortgage Type
Purchase Money Mortgage
Estimated Equity
$42,244
Purchase Details
Closed on
Jan 27, 2012
Sold by
Mckinnie Debberiel
Bought by
Durrani Muhammad Saleem
Home Financials for this Owner
Home Financials are based on the most recent Mortgage that was taken out on this home.
Original Mortgage
$33,900
Outstanding Balance
$23,398
Interest Rate
3.97%
Mortgage Type
Purchase Money Mortgage
Estimated Equity
$42,244
Purchase Details
Closed on
Sep 2, 2004
Sold by
Edward J Sherman Enterprises Inc
Bought by
Mckinnie Debberiel
Create a Home Valuation Report for This Property
The Home Valuation Report is an in-depth analysis detailing your home's value as well as a comparison with similar homes in the area
Home Values in the Area
Average Home Value in this Area
Purchase History
| Date | Buyer | Sale Price | Title Company |
|---|---|---|---|
| Lopez Antonio | -- | None Available | |
| Durrani Muhammad Saleem | -- | None Available | |
| Mckinnie Debberiel | -- | Fidelity National Title |
Source: Public Records
Mortgage History
| Date | Status | Borrower | Loan Amount |
|---|---|---|---|
| Open | Lopez Antonio | $33,900 |
Source: Public Records
Tax History Compared to Growth
Tax History
| Year | Tax Paid | Tax Assessment Tax Assessment Total Assessment is a certain percentage of the fair market value that is determined by local assessors to be the total taxable value of land and additions on the property. | Land | Improvement |
|---|---|---|---|---|
| 2025 | $1,140 | $54,690 | $10,391 | $44,299 |
| 2024 | $1,140 | $51,005 | $9,691 | $41,314 |
| 2023 | $1,140 | $41,812 | $7,944 | $33,868 |
| 2022 | $972 | $41,812 | $7,944 | $33,868 |
| 2021 | $978 | $40,052 | $7,610 | $32,442 |
| 2020 | $728 | $28,786 | $5,469 | $23,317 |
| 2019 | $615 | $23,172 | $4,403 | $18,769 |
| 2018 | $308 | $23,172 | $4,403 | $18,769 |
| 2017 | $609 | $23,172 | $4,403 | $18,769 |
| 2016 | $609 | $23,172 | $4,403 | $18,769 |
| 2015 | $511 | $23,172 | $4,403 | $18,769 |
| 2014 | $511 | $19,261 | $3,660 | $15,601 |
Source: Public Records
Map
Nearby Homes
- 10203 Forum Park Dr Unit 114
- 10202 Forum Park Dr Unit 15
- 10202 Forum Park Dr
- 10110 Forum Dr W Unit 228
- 10110 Forum Dr W Unit D422
- 10110 Forum Dr W Unit 622
- 10110 Forum Dr W Unit 537
- 10110 Forum Dr W Unit 401
- 10110 Forum Dr W Unit 506
- 10110 Forum Dr W Unit 625
- 10110 Forum Dr W Unit 534
- 10110 Forum Dr W Unit 633
- 10110 Forum Dr W Unit 406
- 10110 Forum Dr W Unit 130
- 10403 Forum Park Dr
- 10110 Forum West Dr Unit 421
- 10211 Sugar Branch Dr Unit 324
- 10211 Sugar Branch Dr Unit 434
- 10211 Sugar Branch Dr Unit 436
- 10211 Sugar Branch Dr Unit 338
- 10203 Forum Park Dr Unit 133
- 10203 Forum Park Dr Unit 132
- 10203 Forum Park Dr Unit 103
- 10203 Forum Park Dr Unit 104
- 10203 Forum Park Dr Unit 138
- 10203 Forum Park Dr Unit 240
- 10203 Forum Park Dr Unit 218
- 10203 Forum Park Dr Unit 242
- 10203 Forum Park Dr Unit 241
- 10203 Forum Park Dr Unit 234
- 10203 Forum Park Dr Unit 233
- 10203 Forum Park Dr Unit 232
- 10203 Forum Park Dr Unit 231
- 10203 Forum Park Dr Unit 239
- 10203 Forum Park Dr Unit 142
- 10203 Forum Park Dr Unit 141
- 10203 Forum Park Dr Unit 139
- 10203 Forum Park Dr Unit 238
- 10203 Forum Park Dr Unit 237
- 10203 Forum Park Dr Unit 236