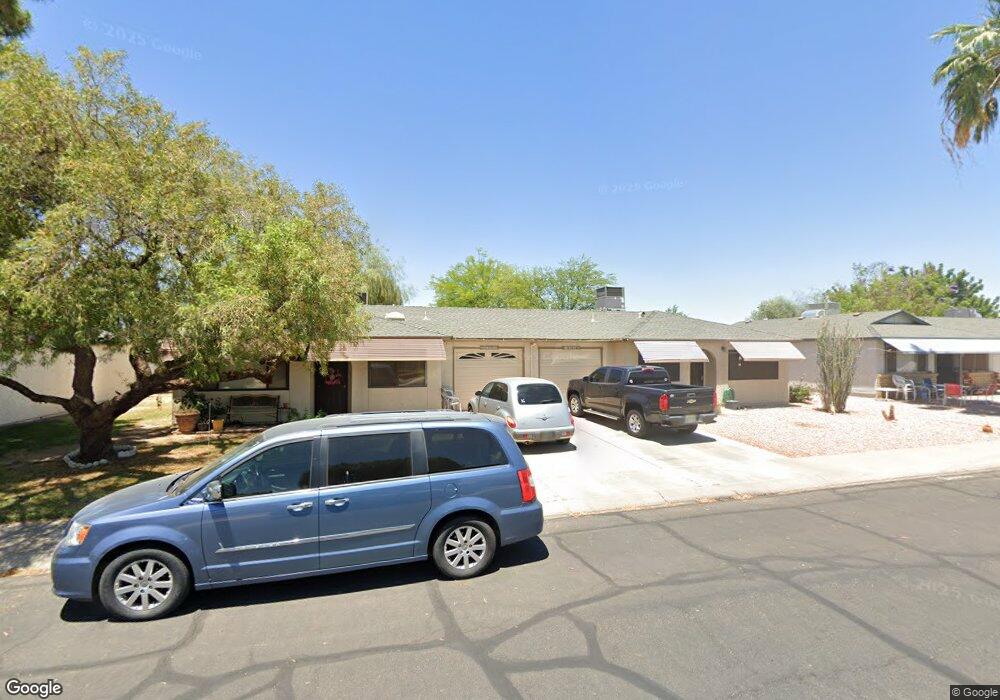
10206 N 97th Dr Unit A Peoria, AZ 85345
Estimated Value: $209,363 - $245,000
--
Bed
2
Baths
1,267
Sq Ft
$184/Sq Ft
Est. Value
About This Home
This home is located at 10206 N 97th Dr Unit A, Peoria, AZ 85345 and is currently estimated at $233,591, approximately $184 per square foot. 10206 N 97th Dr Unit A is a home located in Maricopa County with nearby schools including Sun Valley Elementary School, Raymond S. Kellis, and Ombudsman - Northwest Charter.
Ownership History
Date
Name
Owned For
Owner Type
Purchase Details
Closed on
May 15, 2006
Sold by
Roos Arnold J and Roos Barbara J
Bought by
Roos Arnold J and Roos Barbara J
Current Estimated Value
Home Financials for this Owner
Home Financials are based on the most recent Mortgage that was taken out on this home.
Original Mortgage
$46,000
Interest Rate
6.41%
Mortgage Type
Fannie Mae Freddie Mac
Purchase Details
Closed on
May 4, 2006
Sold by
Roos Arnold J and Roos Barbara J
Bought by
Roos Arnold J and Roos Barbara J
Home Financials for this Owner
Home Financials are based on the most recent Mortgage that was taken out on this home.
Original Mortgage
$46,000
Interest Rate
6.41%
Mortgage Type
Fannie Mae Freddie Mac
Purchase Details
Closed on
May 12, 2005
Sold by
Roos Barbara J
Bought by
Roos Arnold J and Roos Barbara J
Purchase Details
Closed on
Apr 5, 1999
Sold by
Herron Virgil R
Bought by
Herron Virgil R and Roos Barbara
Create a Home Valuation Report for This Property
The Home Valuation Report is an in-depth analysis detailing your home's value as well as a comparison with similar homes in the area
Home Values in the Area
Average Home Value in this Area
Purchase History
| Date | Buyer | Sale Price | Title Company |
|---|---|---|---|
| Roos Arnold J | -- | The Talon Group Tramonto | |
| Roos Arnold J | -- | The Talon Group Tramonto | |
| Roos Arnold J | -- | -- | |
| Roos Barbara J | -- | -- | |
| Herron Virgil R | -- | -- |
Source: Public Records
Mortgage History
| Date | Status | Borrower | Loan Amount |
|---|---|---|---|
| Closed | Roos Arnold J | $46,000 |
Source: Public Records
Tax History Compared to Growth
Tax History
| Year | Tax Paid | Tax Assessment Tax Assessment Total Assessment is a certain percentage of the fair market value that is determined by local assessors to be the total taxable value of land and additions on the property. | Land | Improvement |
|---|---|---|---|---|
| 2025 | $527 | $6,773 | -- | -- |
| 2024 | $519 | $6,450 | -- | -- |
| 2023 | $519 | $18,460 | $3,690 | $14,770 |
| 2022 | $509 | $14,360 | $2,870 | $11,490 |
| 2021 | $544 | $12,500 | $2,500 | $10,000 |
| 2020 | $550 | $11,650 | $2,330 | $9,320 |
| 2019 | $532 | $10,380 | $2,070 | $8,310 |
| 2018 | $514 | $8,410 | $1,680 | $6,730 |
| 2017 | $514 | $6,960 | $1,390 | $5,570 |
| 2016 | $509 | $6,330 | $1,260 | $5,070 |
| 2015 | $475 | $6,320 | $1,260 | $5,060 |
Source: Public Records
Map
Nearby Homes
- 10134 N 97th Ave Unit B
- 10127 N 95th Dr Unit A
- 9627 W North Ln Unit B
- 9616 W Mountain View Rd Unit A
- 10201 N 99th Ave Unit 32A
- 10201 N 99th Ave Unit 46
- 10201 N 99th Ave Unit 44
- 10201 N 99th Ave Unit 97
- 10201 N 99th Ave Unit 34
- 10201 N 99th Ave Unit 28A
- 10201 N 99th Ave Unit 49
- 10201 N 99th Ave Unit 129E
- 10201 N 99th Ave Unit 135F
- 10201 N 99th Ave Unit 3
- 10201 N 99th Ave Unit 160
- 10201 N 99th Ave Unit 149
- 10201 N 99th Ave Unit 2
- 10201 N 99th Ave Unit 33
- 10201 N 99th Ave Unit 152
- 10201 N 99th Ave Unit 21
- 10206 N 97th Dr Unit B
- 10202 N 97th Dr Unit B
- 10202 N 97th Dr Unit A
- 10210 N 97th Dr Unit B
- 10210 N 97th Dr Unit A
- 10149 N 97th Dr Unit B
- 10149 N 97th Dr Unit A
- 10141 N 97th Dr Unit B
- 10141 N 97th Dr Unit A
- 10138 N 97th Dr
- 10138 N 97th Dr Unit B
- 10138 N 97th Dr Unit A
- 10201 N 97th Dr Unit A
- 10201 N 97th Dr Unit B
- 10214 N 97th Dr Unit B
- 10214 N 97th Dr Unit A
- 10133 N 97th Dr Unit B
- 10132 N 97th Dr Unit B
- 10132 N 97th Dr Unit A
- 10205 N 97th Dr Unit A