Estimated Value: $666,000 - $740,000
3
Beds
3
Baths
2,752
Sq Ft
$257/Sq Ft
Est. Value
About This Home
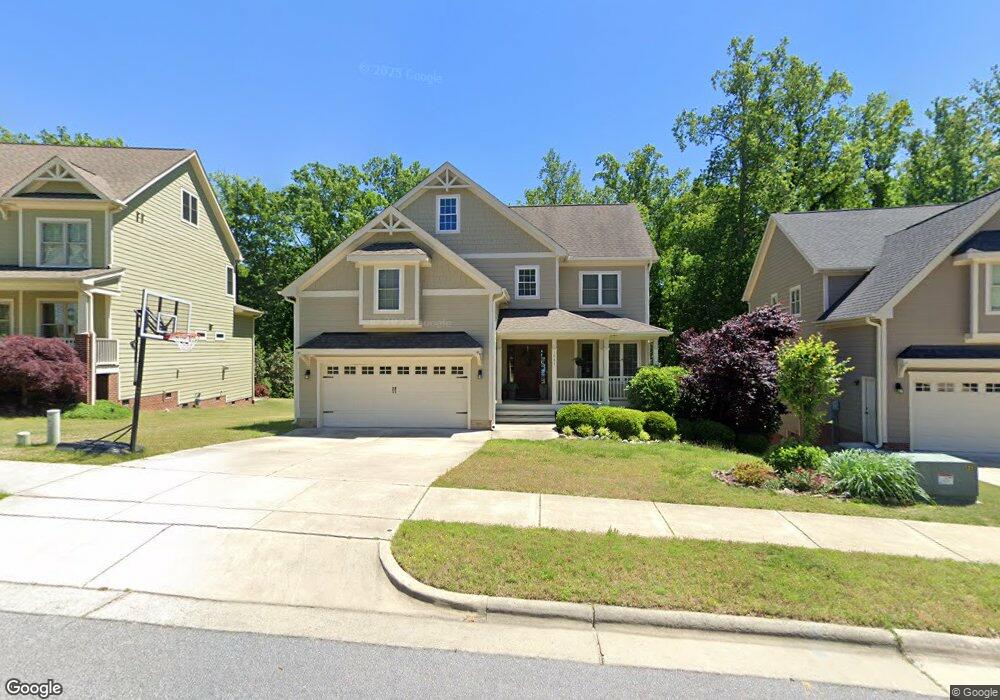
This home is located at 1021 Bexley Hills Bend, Apex, NC 27502 and is currently estimated at $705,936, approximately $256 per square foot. 1021 Bexley Hills Bend is a home located in Wake County with nearby schools including Baucom Elementary School, Apex Middle, and Apex High School.
Ownership History
Date
Name
Owned For
Owner Type
Purchase Details
Closed on
Mar 19, 2020
Sold by
Mickey Bradley D and Mickey Ashley Z
Bought by
Nangle Thomas J and Kinter Leighann
Current Estimated Value
Home Financials for this Owner
Home Financials are based on the most recent Mortgage that was taken out on this home.
Original Mortgage
$300,000
Outstanding Balance
$265,186
Interest Rate
3.4%
Mortgage Type
New Conventional
Estimated Equity
$440,750
Purchase Details
Closed on
Jul 22, 2013
Sold by
Mickey Bradley D and Mickey Ashley Z
Bought by
Mickey Bradley D and Mickey Ashley Z
Purchase Details
Closed on
Jul 25, 2012
Sold by
Brg Builders Llc
Bought by
Mickey Bradley D
Home Financials for this Owner
Home Financials are based on the most recent Mortgage that was taken out on this home.
Original Mortgage
$259,920
Interest Rate
3.72%
Mortgage Type
New Conventional
Purchase Details
Closed on
Dec 7, 2009
Sold by
Brg Construction Company
Bought by
Brg Builders Llc
Create a Home Valuation Report for This Property
The Home Valuation Report is an in-depth analysis detailing your home's value as well as a comparison with similar homes in the area
Home Values in the Area
Average Home Value in this Area
Purchase History
| Date | Buyer | Sale Price | Title Company |
|---|---|---|---|
| Nangle Thomas J | $430,000 | None Available | |
| Nangle Thomas J | $430,000 | None Listed On Document | |
| Mickey Bradley D | -- | None Available | |
| Mickey Bradley D | $325,000 | None Available | |
| Brg Builders Llc | -- | None Available |
Source: Public Records
Mortgage History
| Date | Status | Borrower | Loan Amount |
|---|---|---|---|
| Open | Nangle Thomas J | $300,000 | |
| Closed | Nangle Thomas J | $300,000 | |
| Previous Owner | Mickey Bradley D | $259,920 |
Source: Public Records
Tax History Compared to Growth
Tax History
| Year | Tax Paid | Tax Assessment Tax Assessment Total Assessment is a certain percentage of the fair market value that is determined by local assessors to be the total taxable value of land and additions on the property. | Land | Improvement |
|---|---|---|---|---|
| 2025 | $5,721 | $652,979 | $190,000 | $462,979 |
| 2024 | $5,593 | $652,979 | $190,000 | $462,979 |
| 2023 | $4,695 | $426,161 | $90,000 | $336,161 |
| 2022 | $4,407 | $426,161 | $90,000 | $336,161 |
| 2021 | $4,239 | $426,161 | $90,000 | $336,161 |
| 2020 | $4,196 | $426,161 | $90,000 | $336,161 |
| 2019 | $4,099 | $359,177 | $70,000 | $289,177 |
| 2018 | $3,861 | $359,177 | $70,000 | $289,177 |
| 2017 | $3,594 | $359,177 | $70,000 | $289,177 |
| 2016 | $3,542 | $359,177 | $70,000 | $289,177 |
| 2015 | $3,501 | $346,555 | $62,000 | $284,555 |
| 2014 | -- | $346,555 | $62,000 | $284,555 |
Source: Public Records
Map
Nearby Homes
- 0 Jb Morgan Rd Unit 10051948
- 209 Homegate Cir
- 103 Garden Side Way
- 541 Village Loop Dr
- 1104 Barrow Nook Ct
- 1004 Marston Ct
- 402 Village Loop Dr
- 1614 Brussels Dr
- 1105 Capitata Crossing
- 460 Heritage Village Ln
- 441 Heritage Village Ln
- 448 Heritage Village Ln
- 428 Heritage Village Ln
- 410 2nd St
- 1434 Salem Creek Dr
- 1773 Town Home Dr
- 1116 Silky Dogwood Trail
- 1800 Pierre Place
- 2008 Silky Dogwood Trail
- 506 W Chatham St
- 1017 Bexley Hills Bend
- 1013 Bexley Hills Bend
- 1001 St Emilion Ct
- 1001 Saint Emilion Ct
- 1025 Bexley Hills Bend
- 1008 Bexley Hills Bend
- 1029 Bexley Hills Bend
- 1028 Bexley Hills Bend
- 1005 Bexley Hills Bend
- 1005 Saint Emilion Ct
- 1005 St Emilion Ct
- 1004 Bexley Hills Bend
- 1001 Bexley Hills Bend
- 1009 St Emilion Ct
- 1009 Saint Emilion Ct
- 1010 Saint Emilion Ct
- 1000 Bexley Hills Bend
- 1010 St Emilion Ct
- 1013 St Emilion Ct
- 1013 Saint Emilion Ct