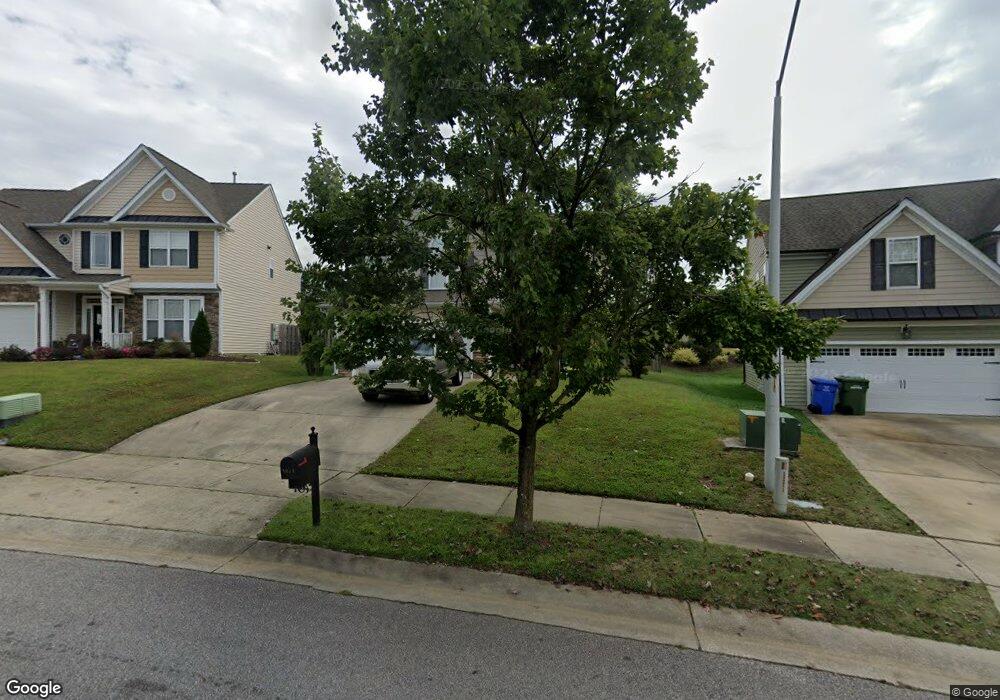
1021 Custom Oak Ln Fuquay Varina, NC 27526
Estimated Value: $426,000 - $454,832
4
Beds
3
Baths
2,897
Sq Ft
$151/Sq Ft
Est. Value
About This Home
This home is located at 1021 Custom Oak Ln, Fuquay Varina, NC 27526 and is currently estimated at $436,208, approximately $150 per square foot. 1021 Custom Oak Ln is a home located in Wake County with nearby schools including Achievement Charter Academy, Southern Wake Academy, and Learning Time Academy.
Ownership History
Date
Name
Owned For
Owner Type
Purchase Details
Closed on
Nov 5, 2019
Sold by
Opendoor Property D Llc
Bought by
Li Tong and Tao Jie
Current Estimated Value
Purchase Details
Closed on
Jun 18, 2019
Sold by
Armstrong Rojone D and Alexander Toshwa N
Bought by
Opendoor Property D Llc
Home Financials for this Owner
Home Financials are based on the most recent Mortgage that was taken out on this home.
Original Mortgage
$400,000,000
Interest Rate
4.1%
Mortgage Type
Commercial
Purchase Details
Closed on
Sep 30, 2010
Sold by
Abbington Heights Llc
Bought by
Armstrong Rojone D and Alexander Toshwa N
Home Financials for this Owner
Home Financials are based on the most recent Mortgage that was taken out on this home.
Original Mortgage
$207,150
Interest Rate
4.44%
Mortgage Type
New Conventional
Purchase Details
Closed on
Mar 14, 2006
Sold by
Psl Development Llc
Bought by
Venture Homes Llc
Create a Home Valuation Report for This Property
The Home Valuation Report is an in-depth analysis detailing your home's value as well as a comparison with similar homes in the area
Home Values in the Area
Average Home Value in this Area
Purchase History
| Date | Buyer | Sale Price | Title Company |
|---|---|---|---|
| Li Tong | $245,000 | None Available | |
| Opendoor Property D Llc | $251,500 | None Available | |
| Armstrong Rojone D | $200,000 | Metro Title Company | |
| Venture Homes Llc | $385,000 | None Available |
Source: Public Records
Mortgage History
| Date | Status | Borrower | Loan Amount |
|---|---|---|---|
| Previous Owner | Opendoor Property D Llc | $400,000,000 | |
| Previous Owner | Armstrong Rojone D | $207,150 |
Source: Public Records
Tax History Compared to Growth
Tax History
| Year | Tax Paid | Tax Assessment Tax Assessment Total Assessment is a certain percentage of the fair market value that is determined by local assessors to be the total taxable value of land and additions on the property. | Land | Improvement |
|---|---|---|---|---|
| 2025 | $4,040 | $459,430 | $80,000 | $379,430 |
| 2024 | $4,024 | $459,430 | $80,000 | $379,430 |
| 2023 | $3,224 | $288,087 | $40,000 | $248,087 |
| 2022 | $3,029 | $288,087 | $40,000 | $248,087 |
| 2021 | $2,886 | $288,087 | $40,000 | $248,087 |
| 2020 | $2,886 | $288,087 | $40,000 | $248,087 |
| 2019 | $2,644 | $227,538 | $40,000 | $187,538 |
| 2018 | $2,493 | $227,538 | $40,000 | $187,538 |
| 2017 | $2,403 | $227,538 | $40,000 | $187,538 |
| 2016 | $2,370 | $227,538 | $40,000 | $187,538 |
| 2015 | $2,379 | $236,034 | $38,000 | $198,034 |
| 2014 | $2,293 | $236,034 | $38,000 | $198,034 |
Source: Public Records
Map
Nearby Homes
- 1036 Steelhorse Dr
- 848 Red Oak Tree Dr
- 1114 Bridlemine Dr
- 904 Bridlemine Dr
- 837 Stable Fern Dr
- 857 Stable Fern Dr
- 817 Stable Fern Dr
- 633 Prickly Pear Dr
- 513 Aspen Grove Dr
- 817 Leatherstone Ln
- 1050 Wagstaff Rd
- 1000 Wagstaff Rd
- 925 Arnold Place Dr
- 509 Timber Meadow Lake Dr
- 610 Silk Tree Trace
- 1113 Matisse Dr
- 900 Cricket Knoll Rd
- 1312 S Main St
- 1408 S Main St
- 1612 S Main St
- 1021 Custom Oak Ln Unit 148
- 1025 Custom Oak Ln
- 1017 Custom Oak Ln
- 1013 Custom Oak Ln
- 1013 Custom Oak Ln Unit Lt150
- 1029 Custom Oak Ln
- 1029 Custom Oak Ln Unit Lt146
- 1022 Custom Oak Ln
- 1032 Steelhorse Dr
- 1040 Steelhorse Dr
- 1009 Custom Oak Ln
- 1028 Steelhorse Dr
- 1033 Custom Oak Ln
- 1010 Custom Oak Ln
- 1044 Steelhorse Dr
- 1024 Steelhorse Dr
- 1005 Custom Oak Ln
- 1005 Custom Oak Ln Unit Lt152
- 1039 Bridlemine Dr
- 1006 Custom Oak Ln