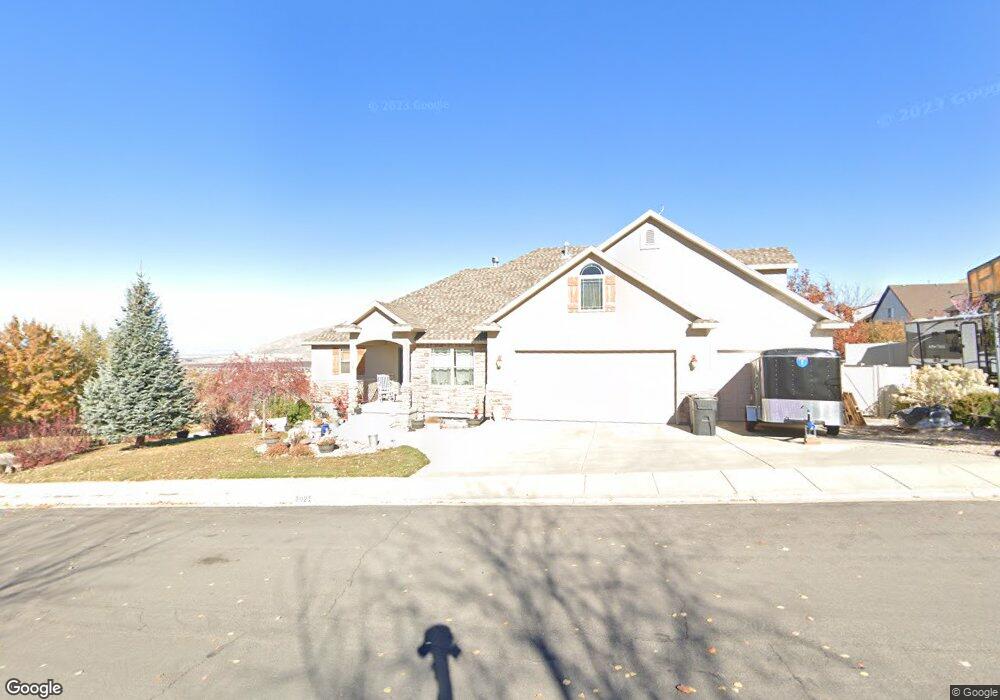
1021 E 300 S Unit 4 Santaquin, UT 84655
Estimated Value: $725,000 - $775,916
4
Beds
6
Baths
2,636
Sq Ft
$287/Sq Ft
Est. Value
About This Home
This home is located at 1021 E 300 S Unit 4, Santaquin, UT 84655 and is currently estimated at $755,639, approximately $286 per square foot. 1021 E 300 S Unit 4 is a home located in Utah County with nearby schools including Orchard Hills Elementary School, Payson Junior High School, and Mt. Nebo Middle.
Ownership History
Date
Name
Owned For
Owner Type
Purchase Details
Closed on
Jun 19, 2017
Sold by
Minor Stephanie Lee
Bought by
Minor Stephanie L and The Stephanie L Minor Trust
Current Estimated Value
Purchase Details
Closed on
Jul 14, 2006
Sold by
Blackhawk Llc
Bought by
Minor Randall Ryan and Minor Stephanie Lee
Home Financials for this Owner
Home Financials are based on the most recent Mortgage that was taken out on this home.
Original Mortgage
$312,920
Interest Rate
6.69%
Mortgage Type
Small Business Administration
Create a Home Valuation Report for This Property
The Home Valuation Report is an in-depth analysis detailing your home's value as well as a comparison with similar homes in the area
Home Values in the Area
Average Home Value in this Area
Purchase History
| Date | Buyer | Sale Price | Title Company |
|---|---|---|---|
| Minor Stephanie L | -- | None Available | |
| Minor Randall Ryan | -- | Quality Title |
Source: Public Records
Mortgage History
| Date | Status | Borrower | Loan Amount |
|---|---|---|---|
| Previous Owner | Minor Randall Ryan | $312,920 |
Source: Public Records
Tax History
| Year | Tax Paid | Tax Assessment Tax Assessment Total Assessment is a certain percentage of the fair market value that is determined by local assessors to be the total taxable value of land and additions on the property. | Land | Improvement |
|---|---|---|---|---|
| 2025 | $3,562 | $414,205 | -- | -- |
| 2024 | $3,562 | $354,750 | $0 | $0 |
| 2023 | $3,529 | $352,550 | $0 | $0 |
| 2022 | $3,741 | $385,440 | $0 | $0 |
| 2021 | $3,169 | $506,100 | $94,300 | $411,800 |
| 2020 | $3,064 | $474,200 | $82,000 | $392,200 |
| 2019 | $2,672 | $423,000 | $82,000 | $341,000 |
| 2018 | $2,726 | $411,400 | $78,100 | $333,300 |
| 2017 | $2,520 | $203,225 | $0 | $0 |
| 2016 | $2,367 | $187,000 | $0 | $0 |
| 2015 | $2,321 | $179,905 | $0 | $0 |
| 2014 | $2,032 | $157,135 | $0 | $0 |
Source: Public Records
Map
Nearby Homes
- 942 E 270 S
- 1171 E 430 S
- 1143 E 430 S
- 141 S 940 E
- 129 S 940 E
- 99 S 940 E
- 499 E 880 S Unit 4
- 955 E 50 S
- 78 N Peach St
- 97 N Oh Henry St
- 202 N Oh Henry St
- 626 S 690 E
- 1975 W Foxwood Rd Unit SH386
- 2174 N York Ln Unit 5
- 1991 W Foxwood Rd Unit SH385
- 1941 W Fox Wood Rd Unit SR388
- 13460 S Highway 6
- 1500 S 5200 W
- 1942 W Foxwood Rd Unit SH384
- 1957 W Foxwood Rd Unit SR387
- 1021 E 300 S
- 1035 E 300 S
- 1035 E 300 S Unit 8
- 279 S 1000 E
- 286 S 1060 E
- 286 S 1060 E Unit 7
- 309 S 1000 E
- 991 E 300 S
- 278 S 1060 E
- 1036 E 300 S
- 1036 E 300 S Unit 2
- 990 E 270 S
- 1022 270 S Unit 5
- 1043 270 S Unit 6
- 324 S 1000 E
- 971 E 300 S Unit 2
- 971 E 300 S
- 1019 E 270 S
- 1019 E 270 S Unit 25
- 1019 E 270 S Unit Lot 9
Your Personal Tour Guide
Ask me questions while you tour the home.