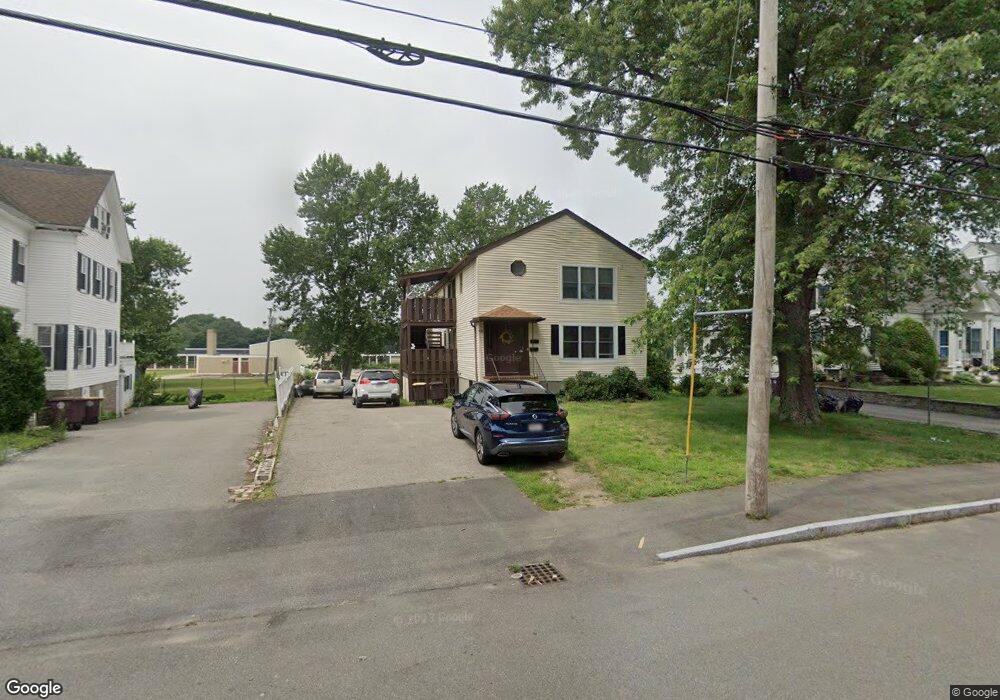
1021 Front St Unit 1023 South Weymouth, MA 02190
South Weymouth NeighborhoodEstimated Value: $657,059 - $869,000
--
Bed
2
Baths
2,496
Sq Ft
$307/Sq Ft
Est. Value
About This Home
This home is located at 1021 Front St Unit 1023, South Weymouth, MA 02190 and is currently estimated at $767,265, approximately $307 per square foot. 1021 Front St Unit 1023 is a home located in Norfolk County with nearby schools including Thomas V Nash, Abigail Adams Middle School, and Weymouth Middle School Chapman.
Ownership History
Date
Name
Owned For
Owner Type
Purchase Details
Closed on
Jul 27, 2001
Sold by
Mallet Paula A
Bought by
Buccheri Peter J and Buccheri Cathleen L
Current Estimated Value
Home Financials for this Owner
Home Financials are based on the most recent Mortgage that was taken out on this home.
Original Mortgage
$165,000
Outstanding Balance
$64,503
Interest Rate
7.18%
Mortgage Type
Purchase Money Mortgage
Estimated Equity
$702,762
Create a Home Valuation Report for This Property
The Home Valuation Report is an in-depth analysis detailing your home's value as well as a comparison with similar homes in the area
Home Values in the Area
Average Home Value in this Area
Purchase History
| Date | Buyer | Sale Price | Title Company |
|---|---|---|---|
| Buccheri Peter J | $195,000 | -- |
Source: Public Records
Mortgage History
| Date | Status | Borrower | Loan Amount |
|---|---|---|---|
| Open | Buccheri Peter J | $165,000 |
Source: Public Records
Tax History Compared to Growth
Tax History
| Year | Tax Paid | Tax Assessment Tax Assessment Total Assessment is a certain percentage of the fair market value that is determined by local assessors to be the total taxable value of land and additions on the property. | Land | Improvement |
|---|---|---|---|---|
| 2025 | $6,201 | $614,000 | $207,200 | $406,800 |
| 2024 | $6,007 | $584,900 | $197,400 | $387,500 |
| 2023 | $5,823 | $557,200 | $182,700 | $374,500 |
| 2022 | $5,643 | $492,400 | $169,200 | $323,200 |
| 2021 | $5,596 | $476,700 | $169,200 | $307,500 |
| 2020 | $5,396 | $452,700 | $169,200 | $283,500 |
| 2019 | $5,261 | $434,100 | $162,700 | $271,400 |
| 2018 | $4,833 | $386,600 | $154,900 | $231,700 |
| 2017 | $4,541 | $354,500 | $147,600 | $206,900 |
| 2016 | $4,357 | $340,400 | $141,900 | $198,500 |
| 2015 | $4,162 | $322,600 | $141,900 | $180,700 |
| 2014 | $4,088 | $307,400 | $132,100 | $175,300 |
Source: Public Records
Map
Nearby Homes
- 2 Mitchell Ln Unit B
- 27 Park Ave
- 2 Tara Dr Unit 1
- 92 Mercury St
- 255 West St
- 262 West St
- 120 Burkhall St Unit K
- 200 Burkhall St Unit 803
- 200 Burkhall St Unit 102
- 110 Burkhall St Unit H
- 191 Tall Oaks Dr Unit C
- 261 Pleasant St Unit 3
- 261 Pleasant St Unit 5
- 200 Justin Dr Unit 3
- 24 Fisher Rd
- 116 Belmont St
- 16 Jay Rd
- 308 Forest St
- 376 Pleasant St
- 45 Union St
- 1025 Front St
- 1025 Front St Unit 1
- 1023 Front St
- 1023 Front St Unit 1 Rear
- 1023 Front St Unit ! Rear
- 1031 Front St
- 1015 Front St
- 1013 Front St
- 1024 Front St
- 589 Main St
- 1037 Front St
- 571 Main St Unit 1
- 571 Main St
- 1009 Front St
- 1041 Front St
- 584 Main St Unit 586
- 580 Main St
- 592 Main St
- 1055 Front St Unit 1057
- 598 Main St