NOT LISTED FOR SALE

1021 Jackson St Belle Fourche, SD 57717

Estimated Value: $76,191 - $161,000

1 Bed
1 Bath
664 Sq Ft
$179/Sq Ft Est. Value

Last Sold November 15, 2013

Last sale price $37,500 $56 Per Sq Ft

Est. 216% increase in value since last sale

Current estimated payment $784/month

8 Days on Market

Highlights

  • Ranch Style House
  • Main Floor Primary Bedroom
  • Bathroom on Main Level
  • Wood Flooring
  • Landscaped with Trees
  • Shed

About This Home

As of November 2013

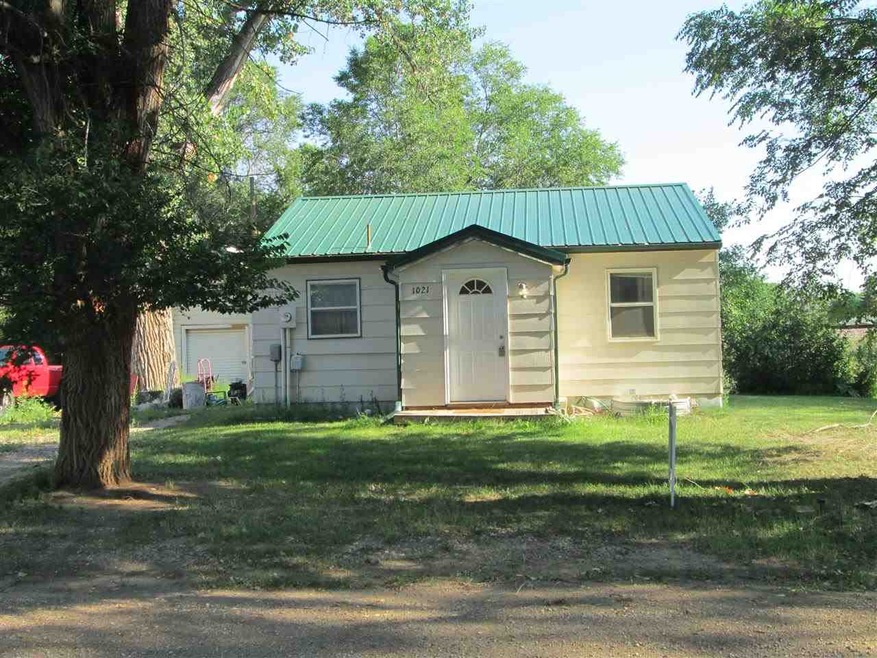
Great little investment property. One bedroom with possibility of more in the basement. Basement is completely unfinished and has possibility of 2 more bedrooms, family room and bathroom. Large lot with plenty of space to build a garage. 12X24 shed with overhead door.

Last Agent to Sell the Property

Judy Johnson

Real Estate Center of Belle Fourche License #00003936 Listed on: 10/23/2013

Last Buyer's Agent

Skyler Massie

eXp Realty License #15509

eXp Realty

Home Details

Home Type

  • Single Family

Year Built

  • Built in 1950

Lot Details

  • Irregular Lot
  • Unpaved Streets
  • Landscaped with Trees

Home Design

  • Ranch Style House
  • Frame Construction
  • Metal Roof
  • Masonite

Interior Spaces

  • 664 Sq Ft Home
  • Vinyl Clad Windows
  • Basement
  • Laundry in Basement
  • Electric Oven or Range

Flooring

  • Wood
  • Vinyl

Bedrooms and Bathrooms

  • 1 Primary Bedroom on Main
  • En-Suite Primary Bedroom
  • Bathroom on Main Level
  • 1 Full Bathroom

Laundry

  • Dryer
  • Washer

Outdoor Features

  • Shed

Utilities

  • Forced Air Heating System
  • Heating System Uses Natural Gas
  • 220 Volts
  • Gas Water Heater
  • Cable TV Available

Home Details

Home Type

Single Family

Year Built

Built in 1950

Lot Details

0

Listing Details

  • Class: RESIDENTIAL
  • Type: Site Built
  • Estimated Total Finished Sq Ft: 664
  • Finished Basement Sq Ft: 00
  • Basement Substructure: Full Basement, Unfinished, Poured Concrete Fd.
  • Basement Total Sq Ft: 664
  • Estimated Dining Room Size: 12x11
  • Dining Rm Level: m
  • Full Three Quarter Bathrooms: 1
  • Estimated Kitchen Size: 11x12
  • Estimated Living Room Size: 15x12
  • Living Rm Level: m
  • Main Level Bathrooms: 1
  • Main Level Fin Sq Ft: 664
  • Main Level Number Bedrooms: 1
  • Main Level Total Sq Ft: 664
  • Estimated Primary Bedroom Size: 10x12
  • Master Bedrm Level: m
  • Primary Bedroom Bath: Yes
  • Personal Property: Refrigerator, Electric Range Oven, Washer, Dryer
  • Sq Ft Above Grade: 664
  • Style: Ranch
  • Systems: Breaker, 220V Service
  • Utilities Cable: Available
  • Utilities Electric: Black Hills Energy
  • Utilities Gas: MDU
  • Year Built: 1950
  • Special Features: None
  • Property Sub Type: Detached

Interior Features

  • Basement: Yes
  • Basement: Yes
  • Estimated Sq Ft: 1000 - 1499
  • Estimated Total Sq Ft: 1328
  • Interior: Wood Floors, Vinyl Flooring
  • Kitchen Level: m
  • Laundry: Basement
  • Number Of Bedrooms: 1
  • Total Sq Ft: 1328
  • Windows: Single Pane, Vinyl

Exterior Features

  • Construction: Frame
  • Landscaping: Trees
  • Exterior: Unpaved Street, Shed
  • Roof: Metal
  • Siding: Masonite Siding

Utilities

  • Heating: Natural Gas, Forced Air
  • Utilities Sewer: City
  • Water: City
  • Water Heater: Gas

Schools

  • School District: Belle Fourche
  • School District: Belle Fourche

Lot Info

  • Acreage: Less than 0.5
  • Lot Description: Irregular
  • Lot Size: 105x181

Tax Info

  • RE Taxes: 1081.10
  • Re Tax Year: 12

Range of Values:

Collateral Analytics

Collateral Analytics Collateral Analytics AVMs (Automated Valuation Model) employ a number of statistical approaches combined with neighborhood-specific comparable selection guarantees the most up-to-date and precise valuations.

Not Available

Collateral Analytics does not have data for the current month. Please view the chart for historical values.

ICE

ICE Mortgage Technology ICE Mortgage Technology’s AVM (Automated Valuation Model) is a state-of-the-art online residential property valuation tool that provides a quick and accurate estimate of the value of almost any home in the U.S.

Not Available

ICE Mortgage Technology does not have data for the current month. Please view the chart for historical values.

First American

First American First American Data & Analytics’ next-generation AVM combines unrivaled data assets with a blended ensemble of valuation models to produce highly accurate, reliable valuations you can trust.

Not Available

First American does not have data for the current month. Please view the chart for historical values.

Quantarium

Quantarium Quantarium’s valuation service, repeatedly proven the industry’s most accurate and comprehensive, is supercharged with a self-learning and auto-tuning AI engine that continually becomes smarter and more accurate as it processes daily inputs from the industry’s leading RE data lake.

Not Available

Quantarium does not have data for the current month. Please view the chart for historical values.

Average Value
Not Available
List Price
Sold Price
Create a Home Valuation Report for This Property
The Home Valuation Report is an in-depth analysis detailing your home's value as well as a comparison with similar homes in the area

Home Values in the Area

Source: Public Records

Average Home Value in this Area


Source: Public Records

Property History

Date Event Price Change Sq Ft Price
11/15/2013 11/15/13 Sold $37,500 -20.2% $56 / Sq Ft
10/31/2013 10/31/13 Pending -- -- --
10/23/2013 10/23/13 For Sale $47,000 -- $71 / Sq Ft
Source: Mount Rushmore Area Association of REALTORS®

Tax History Compared to Growth

Source: Public Records

Tax History

Year Tax Paid Tax Assessment Tax Assessment Total Assessment is a certain percentage of the fair market value that is determined by local assessors to be the total taxable value of land and additions on the property. Land Improvement
2025 $1,641 $111,145 $28,387 $82,758
2024 $1,504 $104,241 $28,387 $75,854
2023 $1,413 $89,600 $24,332 $65,268
2022 $1,413 $77,490 $24,332 $53,158
2021 $1,210 $58,810 $16,221 $42,589
2020 $1,112 $58,810 $16,221 $42,589
2019 $834 $51,712 $16,221 $35,491
2018 $862 $39,561 $16,222 $23,339
2017 $870 $39,561 $16,222 $23,339
2016 $941 $39,561 $16,222 $23,339
2015 -- $39,561 $16,222 $23,339
2014 -- $44,612 $16,222 $28,390
Source: Public Records

Agents Affiliated with this Home

  • Section Image
See All Agents

Map

Source: Mount Rushmore Area Association of REALTORS®

MLS Number: 43318

Mount Rushmore Area Association of REALTORS®

APN: 15.09.F.01