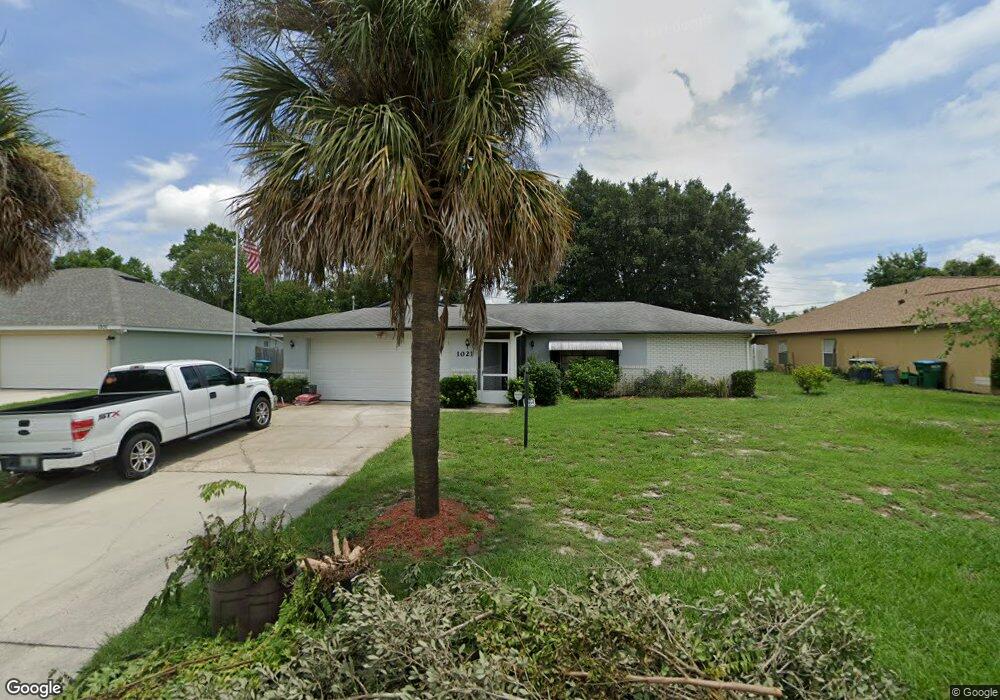
1021 Monterey Dr Deltona, FL 32725
Estimated Value: $214,000 - $273,000
2
Beds
2
Baths
1,251
Sq Ft
$197/Sq Ft
Est. Value
About This Home
This home is located at 1021 Monterey Dr, Deltona, FL 32725 and is currently estimated at $246,223, approximately $196 per square foot. 1021 Monterey Dr is a home located in Volusia County with nearby schools including Spirit Elementary School, Deltona Middle School, and Deltona High School.
Ownership History
Date
Name
Owned For
Owner Type
Purchase Details
Closed on
Mar 24, 2010
Sold by
Buchs Theodore R and Buchs Jenine H
Bought by
Hervieux Rolland and Hervieux Tracey
Current Estimated Value
Purchase Details
Closed on
Jun 6, 2007
Sold by
Buchs Jenine
Bought by
Buchs Theodore R and Buchs Jenine H
Purchase Details
Closed on
Jun 5, 2007
Sold by
Little Marta
Bought by
Buchs Theodore R and Buchs Jenine H
Purchase Details
Closed on
Jun 4, 2007
Sold by
Hall Lydia
Bought by
Buchs Theodore R and Buchs Jenine H
Purchase Details
Closed on
Jul 15, 1985
Bought by
Hervieux Rolland and Hervieux Tracey
Purchase Details
Closed on
Feb 15, 1984
Bought by
Hervieux Rolland and Hervieux Tracey
Purchase Details
Closed on
Jun 15, 1983
Bought by
Hervieux Rolland and Hervieux Tracey
Purchase Details
Closed on
Aug 15, 1969
Bought by
Hervieux Rolland and Hervieux Tracey
Create a Home Valuation Report for This Property
The Home Valuation Report is an in-depth analysis detailing your home's value as well as a comparison with similar homes in the area
Home Values in the Area
Average Home Value in this Area
Purchase History
| Date | Buyer | Sale Price | Title Company |
|---|---|---|---|
| Hervieux Rolland | $70,000 | None Available | |
| Buchs Theodore R | -- | Attorney | |
| Buchs Theodore R | -- | Attorney | |
| Buchs Theodore R | -- | Attorney | |
| Buchs Theodore R | -- | Attorney | |
| Hervieux Rolland | $61,500 | -- | |
| Hervieux Rolland | $50,600 | -- | |
| Hervieux Rolland | $12,500 | -- | |
| Hervieux Rolland | $1,300 | -- |
Source: Public Records
Tax History Compared to Growth
Tax History
| Year | Tax Paid | Tax Assessment Tax Assessment Total Assessment is a certain percentage of the fair market value that is determined by local assessors to be the total taxable value of land and additions on the property. | Land | Improvement |
|---|---|---|---|---|
| 2025 | $3,398 | $193,247 | $53,460 | $139,787 |
| 2024 | $3,398 | $196,379 | $53,460 | $142,919 |
| 2023 | $3,398 | $195,613 | $55,080 | $140,533 |
| 2022 | $3,191 | $177,653 | $35,235 | $142,418 |
| 2021 | $3,016 | $144,333 | $27,135 | $117,198 |
| 2020 | $2,778 | $130,761 | $20,655 | $110,106 |
| 2019 | $2,685 | $123,854 | $17,415 | $106,439 |
| 2018 | $2,487 | $109,413 | $13,932 | $95,481 |
| 2017 | $2,286 | $92,286 | $8,505 | $83,781 |
| 2016 | $2,048 | $78,676 | $0 | $0 |
| 2015 | -- | $72,613 | $0 | $0 |
| 2014 | -- | $63,189 | $0 | $0 |
Source: Public Records
Map
Nearby Homes
- 1057 Fort Smith Blvd
- 1113 Fort Smith Blvd
- 1082 Worthington Dr
- 2067 Everest St
- 968 Fort Smith Blvd
- 1771 S Village Dr
- 1901 Odham Dr
- 2046 Galahad Dr
- 1961 Paragon St
- 973 Radford Dr
- 985 N Village Dr
- 1788 E Normandy Blvd
- 1778 E Normandy Blvd
- 1768 E Normandy Blvd
- 1922 Marlow St
- 1656 Brentlawn St
- 1668 W Waycross Cir
- 910 W Village Dr
- 868 Saxon Blvd
- 732 Fort Smith Blvd
- 1011 Monterey Dr
- 1031 Monterey Dr
- 1082 Fort Smith Blvd
- 1074 Fort Smith Blvd
- 1041 Monterey Dr
- 1022 Monterey Dr
- 1032 Monterey Dr
- 1090 Fort Smith Blvd
- 1012 Monterey Dr
- 1052 Monterey Dr
- 1002 Monterey Dr Unit 13
- 1001 Monterey Dr
- 1874 Marysville Dr
- 1882 Marysville Dr
- 1075 Fort Smith Blvd
- 1866 Marysville Dr
- 1081 Fort Smith Blvd
- 1065 Fort Smith Blvd
- 1890 Marysville Dr
- 1908 Monterey Dr