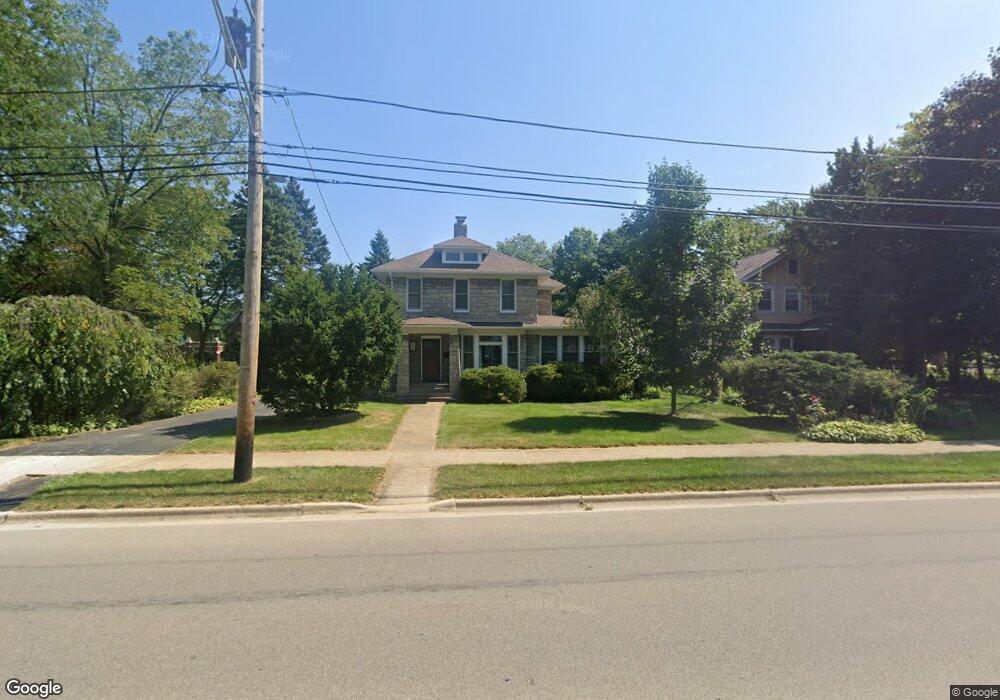
1021 N Sheridan Rd Waukegan, IL 60085
Estimated Value: $325,000 - $441,000
4
Beds
2
Baths
2,364
Sq Ft
$154/Sq Ft
Est. Value
About This Home
This home is located at 1021 N Sheridan Rd, Waukegan, IL 60085 and is currently estimated at $363,519, approximately $153 per square foot. 1021 N Sheridan Rd is a home located in Lake County with nearby schools including Greenwood Elementary School, Edith M Smith Middle School, and Waukegan High School.
Ownership History
Date
Name
Owned For
Owner Type
Purchase Details
Closed on
Jan 14, 2005
Sold by
Eash Florida O and Eash Dennis E
Bought by
Kane Kevin M and Strubbe Mary Rose
Current Estimated Value
Home Financials for this Owner
Home Financials are based on the most recent Mortgage that was taken out on this home.
Original Mortgage
$250,000
Outstanding Balance
$126,033
Interest Rate
5.83%
Mortgage Type
Purchase Money Mortgage
Estimated Equity
$237,486
Purchase Details
Closed on
Sep 11, 2002
Sold by
Carow Christopher J
Bought by
Eash Dennis E and Eash Florida O
Home Financials for this Owner
Home Financials are based on the most recent Mortgage that was taken out on this home.
Original Mortgage
$178,968
Interest Rate
5.25%
Purchase Details
Closed on
May 15, 2001
Sold by
Machowski Barbalyn and Will Of Constance Becklian
Bought by
Carow Christopher J
Home Financials for this Owner
Home Financials are based on the most recent Mortgage that was taken out on this home.
Original Mortgage
$192,850
Interest Rate
7.23%
Create a Home Valuation Report for This Property
The Home Valuation Report is an in-depth analysis detailing your home's value as well as a comparison with similar homes in the area
Home Values in the Area
Average Home Value in this Area
Purchase History
| Date | Buyer | Sale Price | Title Company |
|---|---|---|---|
| Kane Kevin M | $340,000 | Matc | |
| Eash Dennis E | $222,000 | -- | |
| Carow Christopher J | $203,000 | -- |
Source: Public Records
Mortgage History
| Date | Status | Borrower | Loan Amount |
|---|---|---|---|
| Open | Kane Kevin M | $250,000 | |
| Previous Owner | Eash Dennis E | $178,968 | |
| Previous Owner | Carow Christopher J | $192,850 |
Source: Public Records
Tax History Compared to Growth
Tax History
| Year | Tax Paid | Tax Assessment Tax Assessment Total Assessment is a certain percentage of the fair market value that is determined by local assessors to be the total taxable value of land and additions on the property. | Land | Improvement |
|---|---|---|---|---|
| 2024 | $6,534 | $91,299 | $26,689 | $64,610 |
| 2023 | $8,146 | $82,490 | $24,114 | $58,376 |
| 2022 | $8,146 | $94,327 | $39,917 | $54,410 |
| 2021 | $7,809 | $85,899 | $34,436 | $51,463 |
| 2020 | $7,824 | $80,025 | $32,081 | $47,944 |
| 2019 | $7,778 | $73,330 | $29,397 | $43,933 |
| 2018 | $4,215 | $65,084 | $25,474 | $39,610 |
| 2017 | $6,626 | $57,581 | $22,537 | $35,044 |
| 2016 | $6,032 | $50,036 | $19,584 | $30,452 |
| 2015 | $5,707 | $44,783 | $17,528 | $27,255 |
| 2014 | $6,877 | $50,803 | $18,016 | $32,787 |
| 2012 | $7,470 | $55,040 | $19,518 | $35,522 |
Source: Public Records
Map
Nearby Homes
- 415 W Ridgeland Ave
- 723 N County St
- 325 4th St
- 611 N Genesee St
- 1110 N Ash St
- 1122 N Ash St
- 918 N Ash St
- 1336 N Ash St
- 1335 Chestnut St
- 1613 North Ave
- 452 North Ave
- 620 N Poplar St
- 702 Franklin St
- 522 N Poplar St
- 616 W Keith Ave
- 222 Grand Ave
- 428 N Poplar St
- 511 Chestnut St
- 917 N Linden Ave
- 1105 Woodlawn Cir
- 1011 N Sheridan Rd
- 1009 N Sheridan Rd
- 1032 N Sheridan Rd Unit 1B
- 1031 N Sheridan Rd
- 1101 N Sheridan Rd
- 1001 N Sheridan Rd Unit 1001
- 1001 N Sheridan Rd
- 1008 N Sheridan Rd
- 1034 N Sheridan Rd
- 1026 N Sheridan Rd
- 1018 N Sheridan Rd
- 1004 N Sheridan Rd
- 945 N Sheridan Rd
- 1109 N Sheridan Rd
- 1106 N Sheridan Rd
- 216 W Ridgeland Ave
- 219 Stewart Ave Unit 221
- 219 Stewart Ave
- 1110 N Sheridan Rd
- 220 W Ridgeland Ave