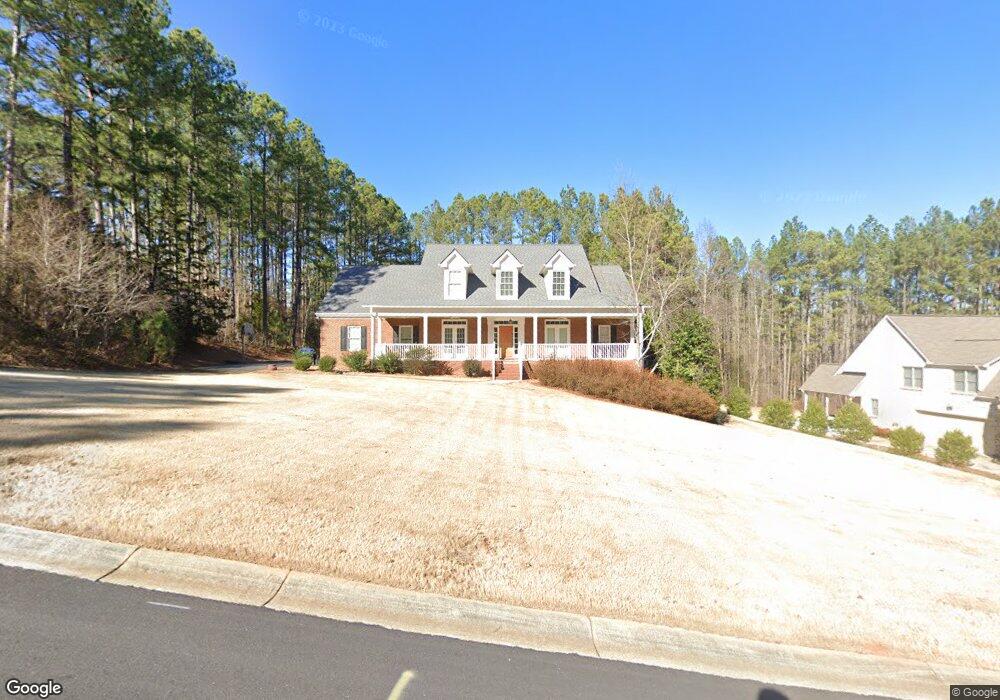
1021 Pin Oak Ct Bishop, GA 30621
Estimated Value: $704,000 - $791,000
4
Beds
4
Baths
2,808
Sq Ft
$264/Sq Ft
Est. Value
About This Home
This home is located at 1021 Pin Oak Ct, Bishop, GA 30621 and is currently estimated at $742,443, approximately $264 per square foot. 1021 Pin Oak Ct is a home located in Oconee County with nearby schools including High Shoals Elementary School, Oconee County Middle School, and Oconee County High School.
Ownership History
Date
Name
Owned For
Owner Type
Purchase Details
Closed on
Apr 28, 2021
Sold by
Costigan Christopher J
Bought by
Costigan Allison R
Current Estimated Value
Home Financials for this Owner
Home Financials are based on the most recent Mortgage that was taken out on this home.
Original Mortgage
$395,000
Outstanding Balance
$357,969
Interest Rate
3.1%
Mortgage Type
New Conventional
Estimated Equity
$384,474
Purchase Details
Closed on
Aug 10, 2007
Sold by
Not Provided
Bought by
Costigan Allison R and Costigan Christopher J
Home Financials for this Owner
Home Financials are based on the most recent Mortgage that was taken out on this home.
Original Mortgage
$380,000
Interest Rate
6.65%
Mortgage Type
New Conventional
Create a Home Valuation Report for This Property
The Home Valuation Report is an in-depth analysis detailing your home's value as well as a comparison with similar homes in the area
Home Values in the Area
Average Home Value in this Area
Purchase History
| Date | Buyer | Sale Price | Title Company |
|---|---|---|---|
| Costigan Allison R | -- | -- | |
| Costigan Allison R | $380,000 | -- |
Source: Public Records
Mortgage History
| Date | Status | Borrower | Loan Amount |
|---|---|---|---|
| Open | Costigan Allison R | $395,000 | |
| Previous Owner | Costigan Allison R | $380,000 |
Source: Public Records
Tax History Compared to Growth
Tax History
| Year | Tax Paid | Tax Assessment Tax Assessment Total Assessment is a certain percentage of the fair market value that is determined by local assessors to be the total taxable value of land and additions on the property. | Land | Improvement |
|---|---|---|---|---|
| 2024 | $4,661 | $226,870 | $33,000 | $193,870 |
| 2023 | $4,240 | $216,509 | $32,000 | $184,509 |
| 2022 | $3,916 | $182,734 | $28,000 | $154,734 |
| 2021 | $3,907 | $169,134 | $28,000 | $141,134 |
| 2020 | $3,732 | $161,323 | $28,000 | $133,323 |
| 2019 | $3,528 | $152,502 | $28,000 | $124,502 |
| 2018 | $3,424 | $144,966 | $24,000 | $120,966 |
| 2017 | $3,291 | $139,324 | $24,000 | $115,324 |
| 2016 | $3,239 | $137,130 | $24,000 | $113,130 |
| 2015 | $3,220 | $136,098 | $24,000 | $112,098 |
| 2014 | $3,328 | $137,496 | $24,000 | $113,496 |
| 2013 | -- | $132,548 | $24,000 | $108,548 |
Source: Public Records
Map
Nearby Homes
- 1011 Persimmon Creek Dr
- 1011 Persimmon Creek Dr Unit Lot 30
- 1031 Pin Oak Ct
- 1020 Pin Oak Ct
- 1031 Persimmon Creek Dr
- 1030 Pin Oak Ct
- 4C Bridgewater Creek Dr
- 16C Bridgewater Creek Dr
- 1040 Pin Oak Ct
- 1176 (1C Bridge Water Creek
- 1176 Bridge Water Creek
- 17C Bridgewater Creek (17c)
- 1010 Persimmon Creek Dr
- 1020 Persimmon Creek Dr
- 1041 Acorn Creek Ct
- 1030 Persimmon Creek Dr
- 1041 (20 Acorn Creek Ct
- 1031 Acorn Creek Ct
- 1031 (21 Acorn Creek Ct
- 1332 Bridgewater Creek Dr