Estimated Value: $306,000 - $317,000
3
Beds
2
Baths
1,697
Sq Ft
$184/Sq Ft
Est. Value
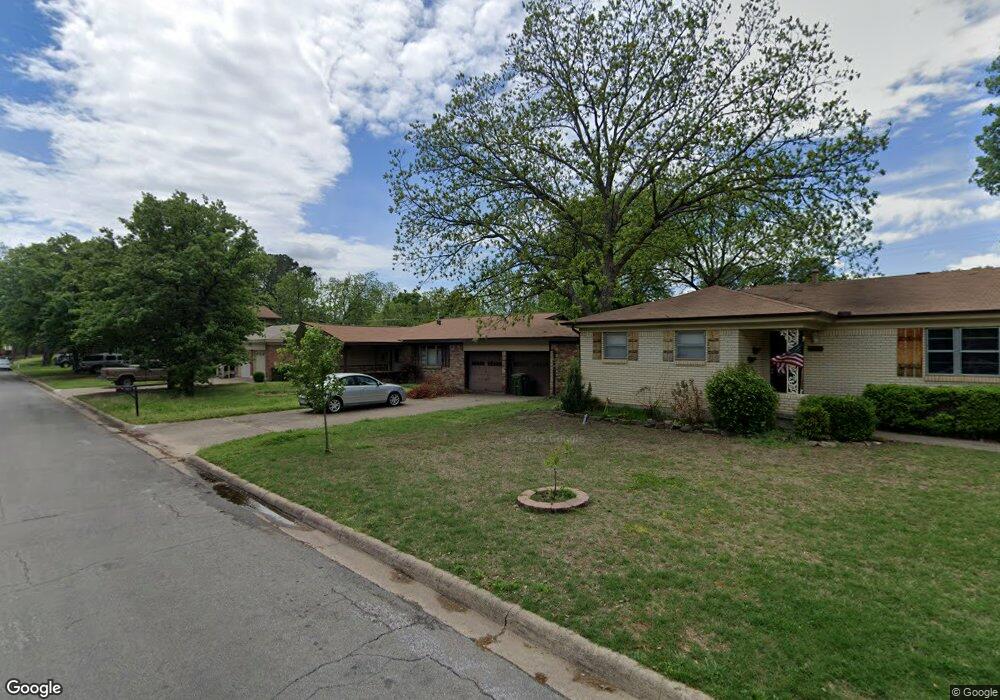
About This Home
This home is located at 1021 Reed St, Hurst, TX 76053 and is currently estimated at $311,965, approximately $183 per square foot. 1021 Reed St is a home located in Tarrant County with nearby schools including Harrison Lane Elementary School, Hurst J High School, and L.D. Bell High School.
Ownership History
Date
Name
Owned For
Owner Type
Purchase Details
Closed on
Jun 19, 2006
Sold by
Wright Brent L
Bought by
Felps John M and Felps Brigitte J
Current Estimated Value
Home Financials for this Owner
Home Financials are based on the most recent Mortgage that was taken out on this home.
Original Mortgage
$91,200
Outstanding Balance
$53,588
Interest Rate
6.56%
Mortgage Type
Purchase Money Mortgage
Estimated Equity
$258,377
Purchase Details
Closed on
Oct 22, 2003
Sold by
Smith Jimmy Lee and Smith Sandra
Bought by
Wright Brent L
Home Financials for this Owner
Home Financials are based on the most recent Mortgage that was taken out on this home.
Original Mortgage
$104,500
Interest Rate
5.99%
Mortgage Type
Purchase Money Mortgage
Create a Home Valuation Report for This Property
The Home Valuation Report is an in-depth analysis detailing your home's value as well as a comparison with similar homes in the area
Home Values in the Area
Average Home Value in this Area
Purchase History
| Date | Buyer | Sale Price | Title Company |
|---|---|---|---|
| Felps John M | -- | Commonwealth Land | |
| Wright Brent L | -- | Safeco Land Title |
Source: Public Records
Mortgage History
| Date | Status | Borrower | Loan Amount |
|---|---|---|---|
| Open | Felps John M | $91,200 | |
| Previous Owner | Wright Brent L | $104,500 |
Source: Public Records
Tax History
| Year | Tax Paid | Tax Assessment Tax Assessment Total Assessment is a certain percentage of the fair market value that is determined by local assessors to be the total taxable value of land and additions on the property. | Land | Improvement |
|---|---|---|---|---|
| 2025 | $3,340 | $305,884 | $65,000 | $240,884 |
| 2024 | $3,340 | $305,884 | $65,000 | $240,884 |
| 2023 | $4,295 | $285,841 | $40,000 | $245,841 |
| 2022 | $4,487 | $263,232 | $40,000 | $223,232 |
| 2021 | $4,273 | $235,186 | $40,000 | $195,186 |
| 2020 | $3,875 | $204,109 | $40,000 | $164,109 |
| 2019 | $3,583 | $194,819 | $40,000 | $154,819 |
| 2018 | $2,721 | $133,100 | $19,000 | $114,100 |
| 2017 | $3,062 | $165,791 | $19,000 | $146,791 |
| 2016 | $2,784 | $140,591 | $19,000 | $121,591 |
| 2015 | $2,226 | $100,000 | $15,000 | $85,000 |
| 2014 | $2,226 | $100,000 | $15,000 | $85,000 |
Source: Public Records
Map
Nearby Homes
- 1016 Keith Dr
- 153 Sheri Ln
- 1113 Norwood Dr
- 209 W Cedar St
- 1148 Simpson Dr
- 701 Harrison Ln
- 1112 Karla Dr
- 1160 Harrison Ln
- 936 Barbara Ann Dr
- 629 Harrison Ln
- 609 Norwood Dr
- 905 Brown Trail
- 802 Brown Trail
- 552 Norwood Dr
- 1236 Harrison Ln
- 624 Forest Ln
- 709 Hurstview Dr
- 528 Buena Vista Dr
- 341 Hurst Dr
- 813 Chase Cir
Your Personal Tour Guide
Ask me questions while you tour the home.