1021 Saint Andrews Ct Greensboro, GA 30642
Estimated Value: $1,048,000 - $1,371,000
--
Bed
3
Baths
1,956
Sq Ft
$639/Sq Ft
Est. Value
About This Home
This home is located at 1021 Saint Andrews Ct, Greensboro, GA 30642 and is currently estimated at $1,249,279, approximately $638 per square foot. 1021 Saint Andrews Ct is a home located in Greene County with nearby schools including Greene County High School.
Ownership History
Date
Name
Owned For
Owner Type
Purchase Details
Closed on
Jul 21, 2022
Sold by
Smith Shirley A
Bought by
Smith Shirley A and Smith Donald L
Current Estimated Value
Purchase Details
Closed on
Feb 28, 2008
Sold by
Fichtner David G
Bought by
Borland James
Purchase Details
Closed on
May 2, 2002
Sold by
Shields James G and Shields Sheila M
Bought by
Alexander Trust--
Purchase Details
Closed on
Aug 19, 1999
Sold by
Power Of Attn-Shields
Bought by
Shields James G and Shields Sheila M
Purchase Details
Closed on
Aug 18, 1999
Sold by
Carr David J and Helen Carr
Bought by
Power Of Attn-Shields
Purchase Details
Closed on
Jul 29, 1999
Sold by
Carr David and Helen Carr
Bought by
Carr David J and Helen Carr
Purchase Details
Closed on
Dec 23, 1997
Sold by
Par Ventures Inc
Bought by
Carr David and Helen Carr
Purchase Details
Closed on
Dec 22, 1995
Sold by
Reliance Trust Co/John Bell
Bought by
Par Ventures Inc
Purchase Details
Closed on
Feb 1, 1994
Sold by
Kenmore Clay
Bought by
Reliance Trust Co/John Bell
Purchase Details
Closed on
Sep 26, 1990
Sold by
Harbor Club Lp
Bought by
Kenmore Clay
Purchase Details
Closed on
Apr 12, 1989
Bought by
Harbor Club Lp
Create a Home Valuation Report for This Property
The Home Valuation Report is an in-depth analysis detailing your home's value as well as a comparison with similar homes in the area
Home Values in the Area
Average Home Value in this Area
Purchase History
| Date | Buyer | Sale Price | Title Company |
|---|---|---|---|
| Smith Shirley A | -- | -- | |
| Borland James | $790,000 | -- | |
| Alexander Trust-- | $518,000 | -- | |
| Shields James G | $459,000 | -- | |
| Power Of Attn-Shields | -- | -- | |
| Carr David J | -- | -- | |
| Carr David | $305,000 | -- | |
| Par Ventures Inc | $40,000 | -- | |
| Reliance Trust Co/John Bell | $39,000 | -- | |
| Kenmore Clay | $75,000 | -- | |
| Harbor Club Lp | -- | -- |
Source: Public Records
Tax History Compared to Growth
Tax History
| Year | Tax Paid | Tax Assessment Tax Assessment Total Assessment is a certain percentage of the fair market value that is determined by local assessors to be the total taxable value of land and additions on the property. | Land | Improvement |
|---|---|---|---|---|
| 2024 | $7,492 | $470,880 | $241,040 | $229,840 |
| 2023 | $7,455 | $469,160 | $235,040 | $234,120 |
| 2022 | $7,520 | $420,720 | $235,040 | $185,680 |
| 2021 | $6,380 | $330,600 | $181,840 | $148,760 |
| 2020 | $4,940 | $231,640 | $105,000 | $126,640 |
| 2019 | $5,083 | $231,640 | $105,000 | $126,640 |
| 2018 | $4,958 | $226,400 | $105,000 | $121,400 |
| 2017 | $4,604 | $224,604 | $105,000 | $119,604 |
| 2016 | $4,631 | $226,332 | $105,000 | $121,332 |
| 2015 | $4,617 | $226,331 | $105,000 | $121,332 |
| 2014 | $4,547 | $217,329 | $105,000 | $112,329 |
Source: Public Records
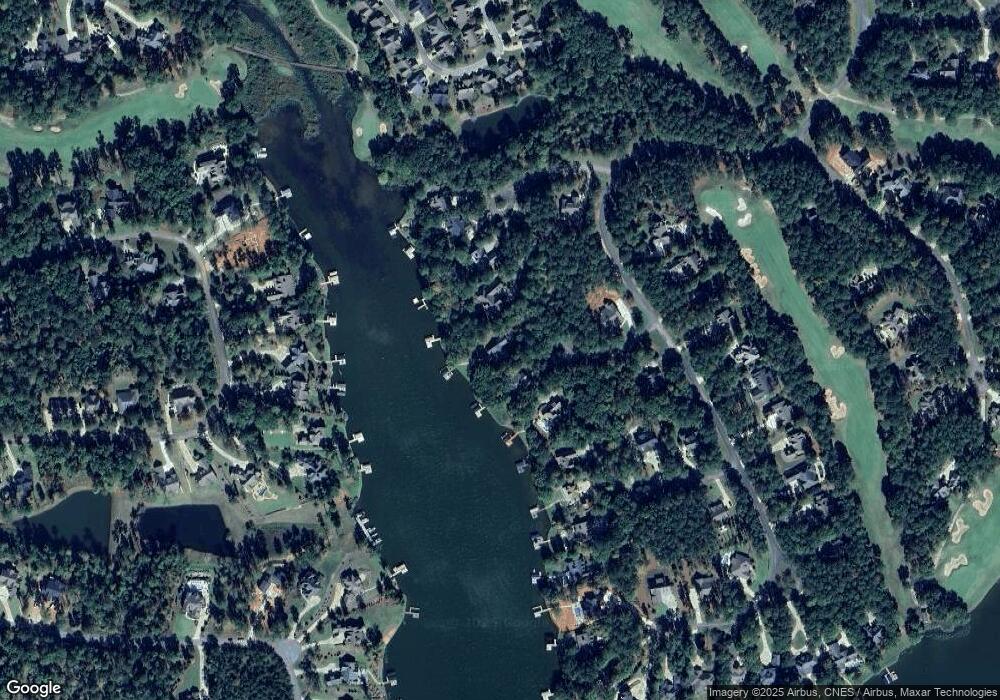
Map
Nearby Homes
- 1010 Troon Ct
- 1132 Harbor Ridge Dr
- 1134 Harbor Ridge Dr
- 1121 Harbor Ridge Dr
- 1080 Glen Eagle Dr
- 1101 Harbor Ridge Dr
- 1070 Glen Eagle Dr
- 1390 Winged Foot Dr
- 1040 Turnberry Cir
- 1170 Harbor Ridge Dr
- 1211 Turnberry Cir
- 1091 Carnoustie
- 1991 Club Dr
- 1050 Spy Glass Hill
- 1000 Glen Eagle Dr
- 1261 Glen Eagle Dr
- 1041 Glen Eagle Dr
- 1020 Oak Valley Rd
- 1030 Saint Andrews Ct
- 1020 Olympic Ct
- 1011 Saint Andrews Ct
- 1020 Saint Andrews Ct
- 1030 Olympic Ct
- 0 Saint Andrews Ct Unit 8235822
- 0 Saint Andrews Ct Unit 8045313
- 0 Saint Andrews Ct Unit 9067556
- 0 Saint Andrews Ct Unit 2070
- 1010 Saint Andrews Ct
- 1001 St Andrews Unit 2070
- 1001 St Andrews
- 1001 Saint Andrews Ct
- 0 Olympic Ct Unit 7092371
- 0 Olympic Ct Unit 9040284
- 0 Olympic Ct Unit 8872953
- 0 Olympic Ct
- 1040 Olympic Ct
- 1021 Troon Ct
- 1241 Winged Foot Dr