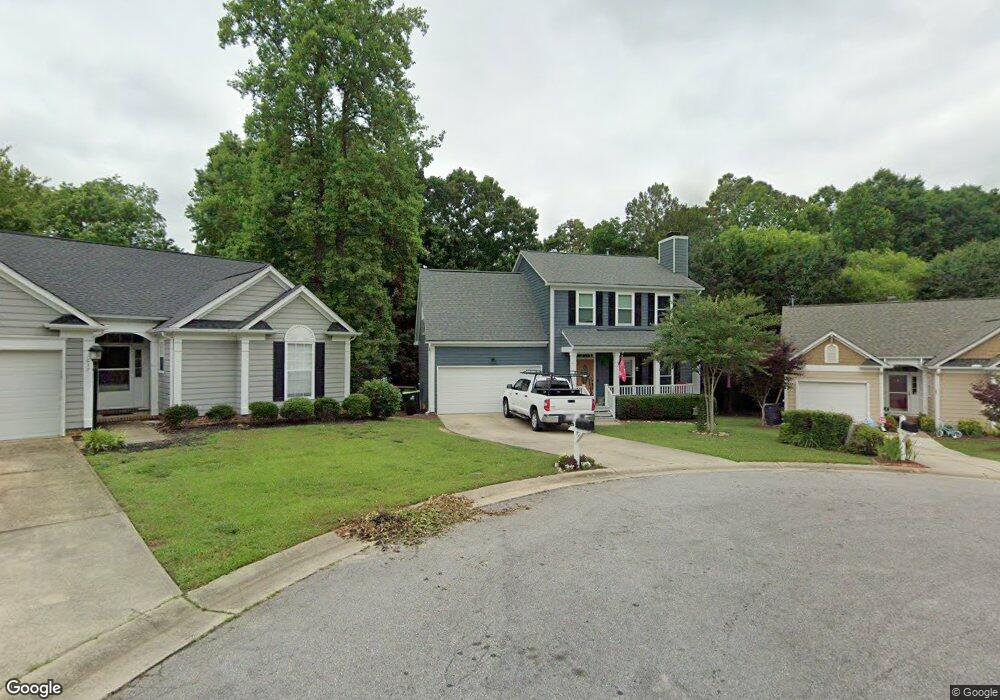
1021 Starkland Way Holly Springs, NC 27540
Estimated Value: $398,000 - $425,000
3
Beds
3
Baths
1,605
Sq Ft
$257/Sq Ft
Est. Value
About This Home
This home is located at 1021 Starkland Way, Holly Springs, NC 27540 and is currently estimated at $412,185, approximately $256 per square foot. 1021 Starkland Way is a home located in Wake County with nearby schools including Oakview Elementary School, Apex Friendship Middle School, and Holly Springs High School.
Ownership History
Date
Name
Owned For
Owner Type
Purchase Details
Closed on
May 18, 2015
Sold by
National Transfer Services Llc
Bought by
Winokur Shane and Winokur Stephanie
Current Estimated Value
Home Financials for this Owner
Home Financials are based on the most recent Mortgage that was taken out on this home.
Original Mortgage
$163,400
Outstanding Balance
$126,378
Interest Rate
3.79%
Mortgage Type
New Conventional
Estimated Equity
$285,807
Purchase Details
Closed on
Jul 25, 2012
Sold by
Pendry Tyler R
Bought by
Pendry Tyler R and Stano Kelly L
Home Financials for this Owner
Home Financials are based on the most recent Mortgage that was taken out on this home.
Original Mortgage
$178,571
Interest Rate
3.72%
Mortgage Type
New Conventional
Create a Home Valuation Report for This Property
The Home Valuation Report is an in-depth analysis detailing your home's value as well as a comparison with similar homes in the area
Home Values in the Area
Average Home Value in this Area
Purchase History
| Date | Buyer | Sale Price | Title Company |
|---|---|---|---|
| Winokur Shane | $204,500 | None Available | |
| National Transfer Services Llc | $204,500 | None Available | |
| Pendry Tyler R | -- | None Available | |
| Pendry Tyler R | $175,000 | Tryon Title Agency Llc |
Source: Public Records
Mortgage History
| Date | Status | Borrower | Loan Amount |
|---|---|---|---|
| Open | National Transfer Services Llc | $163,400 | |
| Closed | National Transfer Services Llc | $163,400 | |
| Previous Owner | Pendry Tyler R | $178,571 |
Source: Public Records
Tax History Compared to Growth
Tax History
| Year | Tax Paid | Tax Assessment Tax Assessment Total Assessment is a certain percentage of the fair market value that is determined by local assessors to be the total taxable value of land and additions on the property. | Land | Improvement |
|---|---|---|---|---|
| 2025 | $3,440 | $397,343 | $115,000 | $282,343 |
| 2024 | $3,425 | $397,343 | $115,000 | $282,343 |
| 2023 | $2,591 | $238,362 | $50,000 | $188,362 |
| 2022 | $2,502 | $238,362 | $50,000 | $188,362 |
| 2021 | $2,455 | $238,362 | $50,000 | $188,362 |
| 2020 | $2,455 | $238,362 | $50,000 | $188,362 |
| 2019 | $2,281 | $187,922 | $50,000 | $137,922 |
| 2018 | $2,063 | $187,922 | $50,000 | $137,922 |
| 2017 | $1,988 | $187,922 | $50,000 | $137,922 |
| 2016 | $1,961 | $187,922 | $50,000 | $137,922 |
| 2015 | $1,771 | $166,878 | $35,000 | $131,878 |
| 2014 | $1,710 | $166,878 | $35,000 | $131,878 |
Source: Public Records
Map
Nearby Homes
- 713 Littleleaf Ct
- 725 Little Leaf Ct
- 717 Starkland Way
- 329 N Main St
- 105 Townsgate Ct
- 109 Bright Shade Ct
- 108 Crabwall Ct
- 321 Blalock St
- 318 Blalock St
- 225 Douglas St
- 124 Cliffdale Rd
- 737 W Holly Springs Rd
- 743 W Holly Springs Rd
- 112 Burt St
- 749 W Holly Springs Rd
- 755 W Holly Springs Rd
- 761 W Holly Springs Rd
- 112 Sanchez Ct
- 105 Cross Hill Ln
- 138 Cobalt Creek Way
- 1017 Starkland Way
- 1025 Starkland Way
- 800 Sweetwood Trace Ct
- 1013 Starkland Way
- 804 Sweetwood Trace Ct
- 805 Chambord Way
- 1009 Starkland Way
- 1020 Starkland Way
- 801 Chambord Way
- 801 Sweetwood Trace Ct
- 1016 Starkland Way
- 1005 Starkland Way
- 1012 Starkland Way
- 808 Sweetwood Trace Ct
- 809 Chambord Way
- 908 Silverstone Way
- 1008 Starkland Way
- 805 Pensby Ct
- 1001 Starkland Way
- 904 Silverstone Way