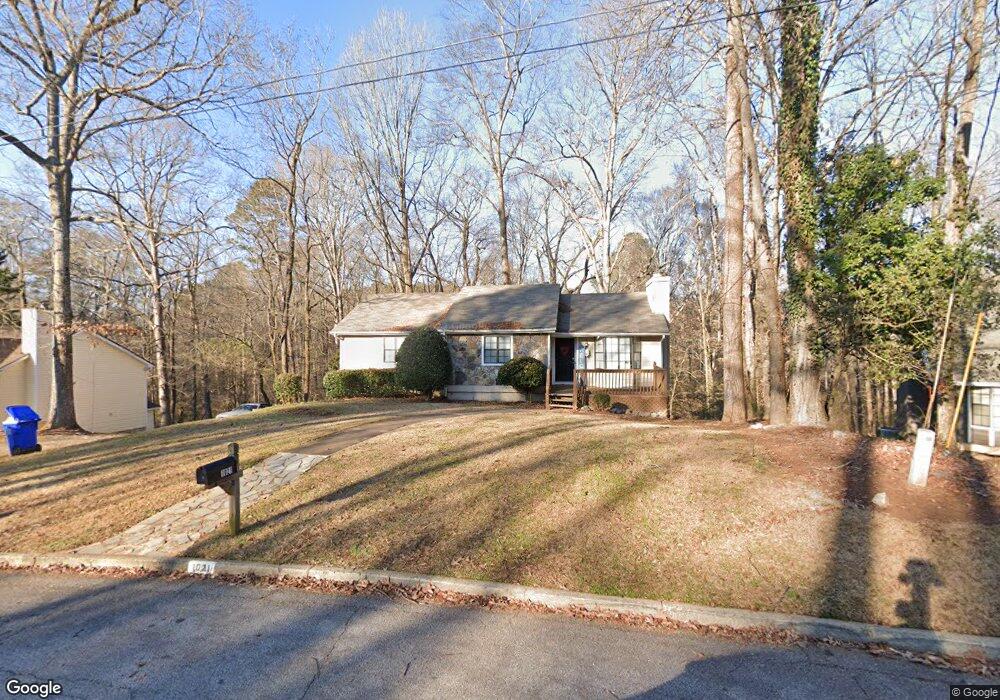
1021 Timbervale Ln Unit 2 Lithonia, GA 30058
Estimated Value: $206,000 - $231,000
3
Beds
2
Baths
1,302
Sq Ft
$169/Sq Ft
Est. Value
About This Home
This home is located at 1021 Timbervale Ln Unit 2, Lithonia, GA 30058 and is currently estimated at $220,688, approximately $169 per square foot. 1021 Timbervale Ln Unit 2 is a home located in DeKalb County with nearby schools including Princeton Elementary School, Stephenson Middle School, and Stephenson High School.
Ownership History
Date
Name
Owned For
Owner Type
Purchase Details
Closed on
Apr 6, 2017
Sold by
Resi Sfr Sub Llc
Bought by
Resi Tl1 Borrower Llc
Current Estimated Value
Purchase Details
Closed on
Jun 24, 2016
Sold by
Starwood Waypoint Trs Llc
Bought by
Resi Sfr Sub Llc
Purchase Details
Closed on
Jul 14, 2015
Sold by
Beauly Llc
Bought by
Starwood Waypoint Trs Llc
Purchase Details
Closed on
Mar 28, 2014
Sold by
Bank Of America Na
Bought by
Beauty Llc
Purchase Details
Closed on
Jul 3, 2012
Sold by
Woodward Barbara J
Bought by
Bank Of America Na
Purchase Details
Closed on
Dec 16, 1993
Sold by
Reichenberg Greg and Reichenberg Anne S
Bought by
Leaks Alvin
Home Financials for this Owner
Home Financials are based on the most recent Mortgage that was taken out on this home.
Original Mortgage
$73,750
Interest Rate
7.05%
Mortgage Type
FHA
Create a Home Valuation Report for This Property
The Home Valuation Report is an in-depth analysis detailing your home's value as well as a comparison with similar homes in the area
Home Values in the Area
Average Home Value in this Area
Purchase History
| Date | Buyer | Sale Price | Title Company |
|---|---|---|---|
| Resi Tl1 Borrower Llc | -- | -- | |
| Resi Sfr Sub Llc | $84,000 | -- | |
| Starwood Waypoint Trs Llc | -- | -- | |
| Beauty Llc | $48,000 | -- | |
| Bank Of America Na | $119,148 | -- | |
| Leaks Alvin | $74,900 | -- |
Source: Public Records
Mortgage History
| Date | Status | Borrower | Loan Amount |
|---|---|---|---|
| Previous Owner | Leaks Alvin | $73,750 |
Source: Public Records
Tax History Compared to Growth
Tax History
| Year | Tax Paid | Tax Assessment Tax Assessment Total Assessment is a certain percentage of the fair market value that is determined by local assessors to be the total taxable value of land and additions on the property. | Land | Improvement |
|---|---|---|---|---|
| 2025 | $4,489 | $91,600 | $16,000 | $75,600 |
| 2024 | $3,607 | $71,480 | $10,007 | $61,473 |
| 2023 | $3,607 | $71,480 | $10,007 | $61,473 |
| 2022 | $2,233 | $73,680 | $10,000 | $63,680 |
| 2021 | $2,233 | $42,360 | $5,600 | $36,760 |
| 2020 | $2,233 | $42,360 | $5,600 | $36,760 |
| 2019 | $2,279 | $43,400 | $5,600 | $37,800 |
| 2018 | $1,817 | $35,320 | $5,600 | $29,720 |
| 2017 | $1,774 | $31,760 | $5,600 | $26,160 |
| 2016 | $1,876 | $34,000 | $5,600 | $28,400 |
| 2014 | $975 | $13,280 | $3,840 | $9,440 |
Source: Public Records
Map
Nearby Homes
- 6743 Timbers Dr E
- 812 Sweet Pine Brook
- Hazel Plan at Summertree
- Elder Plan at Summertree
- Cedar Plan at Summertree
- Fairview Plan at Summertree
- 6675 Princeton Park Ct
- 6643 Red Oak Way
- 6875 Timberclair Ct
- 1168 Stephenson Rd
- 1086 Deshon Trail
- 711 Ashley Ln
- 1773 Stephenson Rd
- 6543 Alford Way
- 676 Bralorne Dr
- 886 Deshon Creek Dr
- 648 Bralorne Dr
- 754 Shore Dr
- 7071 Deshon Hills Ln
- 1276 Huntington Place Cir
- 1013 Timbervale Ln Unit 2
- 1029 Timbervale Ln
- 1039 Timbervale Ln Unit 2
- 1018 Timbervale Ln Unit 2
- 1006 Timbervale Ln
- 1030 Timbervale Ln Unit 2
- 1040 Timbervale Ln
- 996 Timbervale Ln Unit 2
- 1047 Timbervale Ln
- 1048 Timbervale Ln
- 1055 Timbervale Ln
- 984 Timbervale Ln
- 989 Timbervale Ln
- 1058 Timbervale Ln Unit 2
- 6769 Timbers East Dr
- 6761 Timbers East Dr Unit 2
- 6761 Timbers Dr E
- 6777 Timbers East Dr Unit 2
- 6753 Timbers East Dr
- 972 Timbervale Ln