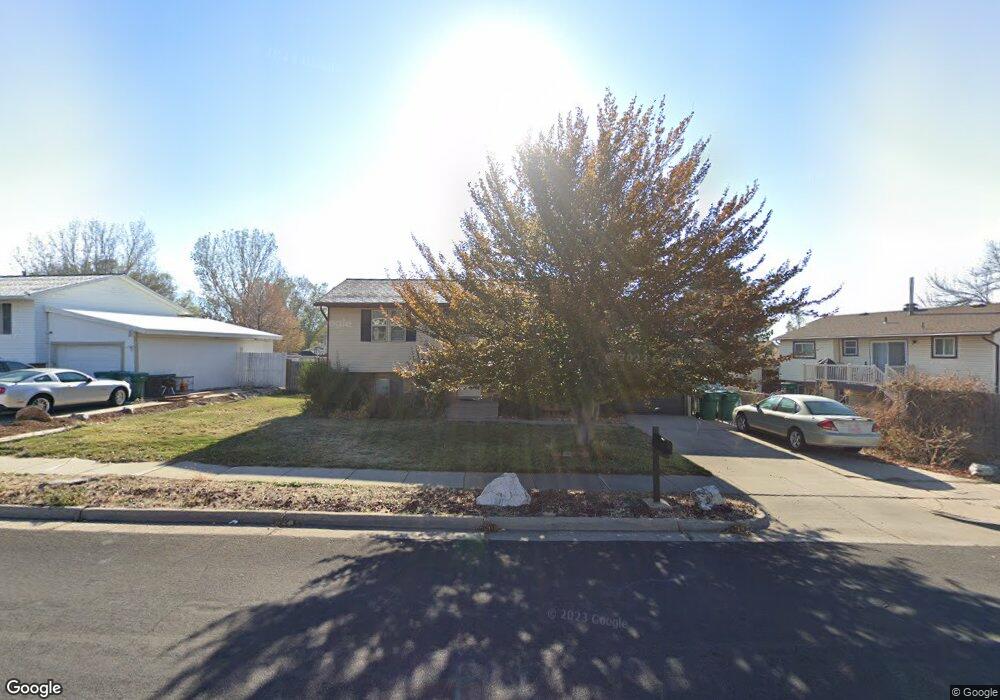
1021 W 2200 N Layton, UT 84041
Estimated Value: $384,000 - $433,142
4
Beds
2
Baths
1,644
Sq Ft
$254/Sq Ft
Est. Value
About This Home
This home is located at 1021 W 2200 N, Layton, UT 84041 and is currently estimated at $416,786, approximately $253 per square foot. 1021 W 2200 N is a home located in Davis County with nearby schools including Lincoln Elementary School, North Layton Junior High School, and Northridge High School.
Ownership History
Date
Name
Owned For
Owner Type
Purchase Details
Closed on
Nov 14, 2017
Sold by
Woolcott Gary M
Bought by
Tolman Zachary B and Tolman Alicia L
Current Estimated Value
Home Financials for this Owner
Home Financials are based on the most recent Mortgage that was taken out on this home.
Original Mortgage
$110,700
Outstanding Balance
$92,540
Interest Rate
3.85%
Mortgage Type
New Conventional
Estimated Equity
$324,246
Purchase Details
Closed on
Feb 27, 2001
Sold by
Charney Robert E and Charney Eula
Bought by
Jackson Keith M and Jackson Stephanie J
Home Financials for this Owner
Home Financials are based on the most recent Mortgage that was taken out on this home.
Original Mortgage
$115,913
Interest Rate
6.98%
Mortgage Type
FHA
Purchase Details
Closed on
May 19, 2000
Sold by
Prymek Terrance D
Bought by
Charney Robert E and Charney Eula
Home Financials for this Owner
Home Financials are based on the most recent Mortgage that was taken out on this home.
Original Mortgage
$111,050
Interest Rate
8.08%
Create a Home Valuation Report for This Property
The Home Valuation Report is an in-depth analysis detailing your home's value as well as a comparison with similar homes in the area
Home Values in the Area
Average Home Value in this Area
Purchase History
| Date | Buyer | Sale Price | Title Company |
|---|---|---|---|
| Tolman Zachary B | -- | Us Title | |
| Jackson Keith M | -- | Backman Stewart Title Servic | |
| Charney Robert E | -- | Security Title Company |
Source: Public Records
Mortgage History
| Date | Status | Borrower | Loan Amount |
|---|---|---|---|
| Open | Tolman Zachary B | $110,700 | |
| Previous Owner | Jackson Keith M | $115,913 | |
| Previous Owner | Charney Robert E | $111,050 |
Source: Public Records
Tax History Compared to Growth
Tax History
| Year | Tax Paid | Tax Assessment Tax Assessment Total Assessment is a certain percentage of the fair market value that is determined by local assessors to be the total taxable value of land and additions on the property. | Land | Improvement |
|---|---|---|---|---|
| 2025 | $1,939 | $203,500 | $102,245 | $101,255 |
| 2024 | $1,857 | $196,350 | $119,122 | $77,228 |
| 2023 | $1,846 | $344,000 | $141,490 | $202,510 |
| 2022 | $2,000 | $202,400 | $74,847 | $127,553 |
| 2021 | $1,875 | $283,000 | $105,091 | $177,909 |
| 2020 | $1,685 | $244,000 | $88,384 | $155,616 |
| 2019 | $1,671 | $237,000 | $83,905 | $153,095 |
| 2018 | $1,503 | $214,000 | $83,905 | $130,095 |
| 2016 | $1,130 | $82,995 | $26,834 | $56,161 |
| 2015 | $1,097 | $76,485 | $27,162 | $49,323 |
| 2014 | $901 | $64,273 | $27,162 | $37,111 |
| 2013 | -- | $70,759 | $18,612 | $52,147 |
Source: Public Records
Map
Nearby Homes
- 2298 N 1085 W
- 1155 W 2200 N
- 2149 N 750 W
- 2211 N 525 W
- 506 W 2200 N
- 2248 N 500 W
- 2233 N 475 W
- 538 W 1875 N
- 1094 N Angel St W
- 1036 N Angel St W
- 1615 N Angel St W
- 1425 W 1650 N
- 1574 W 1920 N
- 1606 W 1960 N
- 1615 N Angel St Unit F
- 1615 N Angel St Unit I
- 1615 N Angel St Unit E
- 1615 N Angel St Unit B
- 1615 N Angel St
- 1615 N Angel St Unit C