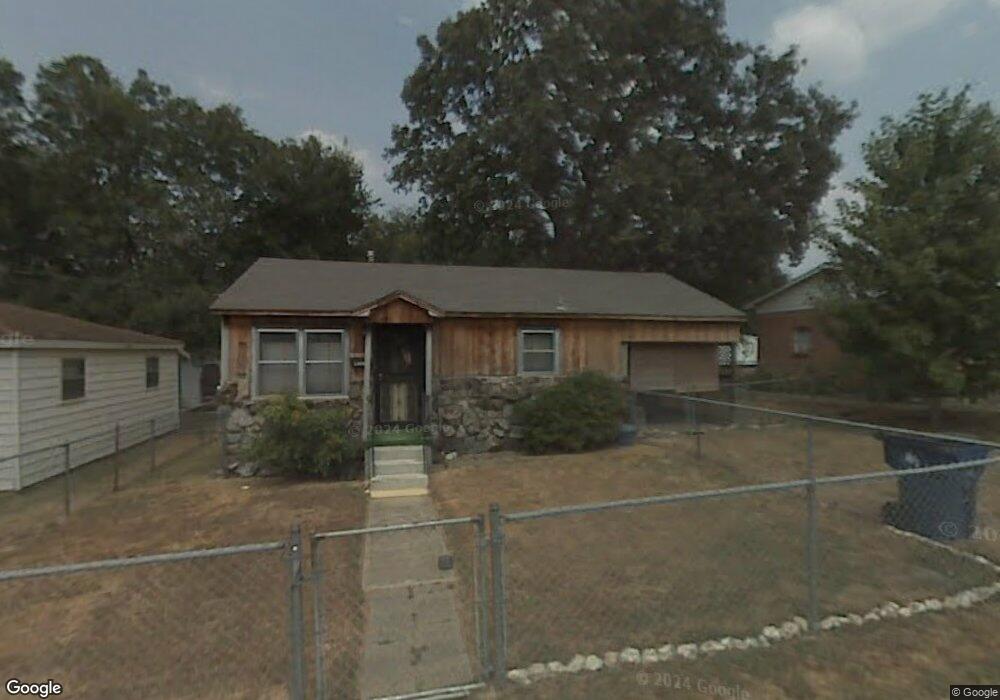
1021 W Hazel St Benton, AR 72015
Estimated Value: $98,156 - $128,000
--
Bed
1
Bath
952
Sq Ft
$121/Sq Ft
Est. Value
About This Home
This home is located at 1021 W Hazel St, Benton, AR 72015 and is currently estimated at $115,539, approximately $121 per square foot. 1021 W Hazel St is a home located in Saline County with nearby schools including Ringgold Elementary School, Benton Middle School, and Benton Junior High School.
Ownership History
Date
Name
Owned For
Owner Type
Purchase Details
Closed on
Nov 2, 2017
Sold by
Mi Casa Su Casa Llc
Bought by
Bradley Brenda
Current Estimated Value
Home Financials for this Owner
Home Financials are based on the most recent Mortgage that was taken out on this home.
Original Mortgage
$76,000
Outstanding Balance
$41,763
Interest Rate
3.85%
Mortgage Type
New Conventional
Estimated Equity
$73,776
Purchase Details
Closed on
Oct 28, 2016
Sold by
Nationstar Mortgage Llc
Bought by
Mi Casa Su Sasa Llc
Purchase Details
Closed on
Aug 26, 2016
Sold by
Ferrell Michael W
Bought by
Nationstar Morgage Llc
Purchase Details
Closed on
Jan 7, 2000
Bought by
Ferrell
Purchase Details
Closed on
Oct 4, 1999
Bought by
Davis
Purchase Details
Closed on
Sep 7, 1995
Bought by
Reynolds
Purchase Details
Closed on
Feb 1, 1993
Bought by
Howell
Purchase Details
Closed on
Nov 1, 1991
Bought by
Beckwith
Create a Home Valuation Report for This Property
The Home Valuation Report is an in-depth analysis detailing your home's value as well as a comparison with similar homes in the area
Home Values in the Area
Average Home Value in this Area
Purchase History
| Date | Buyer | Sale Price | Title Company |
|---|---|---|---|
| Bradley Brenda | $80,000 | Standard Abstract & Title Co | |
| Mi Casa Su Sasa Llc | $15,277 | None Available | |
| Nationstar Morgage Llc | -- | None Available | |
| Ferrell | $52,000 | -- | |
| Davis | $35,000 | -- | |
| Reynolds | $163,000 | -- | |
| Howell | $33,000 | -- | |
| Beckwith | $7,000 | -- |
Source: Public Records
Mortgage History
| Date | Status | Borrower | Loan Amount |
|---|---|---|---|
| Open | Bradley Brenda | $76,000 |
Source: Public Records
Tax History Compared to Growth
Tax History
| Year | Tax Paid | Tax Assessment Tax Assessment Total Assessment is a certain percentage of the fair market value that is determined by local assessors to be the total taxable value of land and additions on the property. | Land | Improvement |
|---|---|---|---|---|
| 2025 | $469 | $11,461 | $2,600 | $8,861 |
| 2024 | $480 | $11,461 | $2,600 | $8,861 |
| 2023 | $23 | $11,461 | $2,600 | $8,861 |
| 2022 | $53 | $11,461 | $2,600 | $8,861 |
| 2021 | $32 | $7,350 | $2,000 | $5,350 |
| 2020 | $32 | $7,350 | $2,000 | $5,350 |
| 2019 | $32 | $7,350 | $2,000 | $5,350 |
| 2018 | $56 | $7,350 | $2,000 | $5,350 |
| 2017 | $56 | $7,350 | $2,000 | $5,350 |
| 2016 | $534 | $9,410 | $2,000 | $7,410 |
| 2015 | $524 | $9,410 | $2,000 | $7,410 |
| 2014 | $528 | $9,410 | $2,000 | $7,410 |
Source: Public Records
Map
Nearby Homes
- 1212 Jackman St
- 416 Marion St
- 418 Jefferson St
- 1242 Maple-504 Harding E & Mhp
- 1298 Maple St
- 1302 W Maple St
- 416 Jackman St
- 801 S Market
- 722 S Market
- 1500 W Sevier St
- 402 S Market
- 2016 U St
- 401 W South St
- 209 Crouch
- 308 N Olive St
- 1105 S East St
- 1502,1504&1520 Sorrel
- 6 Acres S Beggs and I-30 Service Rd
- Lot 10 Dale Road Acres
- Lot 9 Dale Road Acres
- 1019 W Hazel St
- 807 Spangle St
- 1020 W Hazel St
- 805 Spangle St
- 1013 W Hazel St
- 906 Spangle St
- 1007 W Hazel St
- 1016 Thelma St
- 803 Spangle St
- 1020 Thelma St
- 811 Spangle St
- 801 Spangle St
- 1012 Thelma St
- 1026 Thelma St
- 1005 W Hazel St
- 721 Spangle St
- 1006 W Hazel St
- 1102 Thelma St
- 1015 Neal St
- 1002 Thelma St