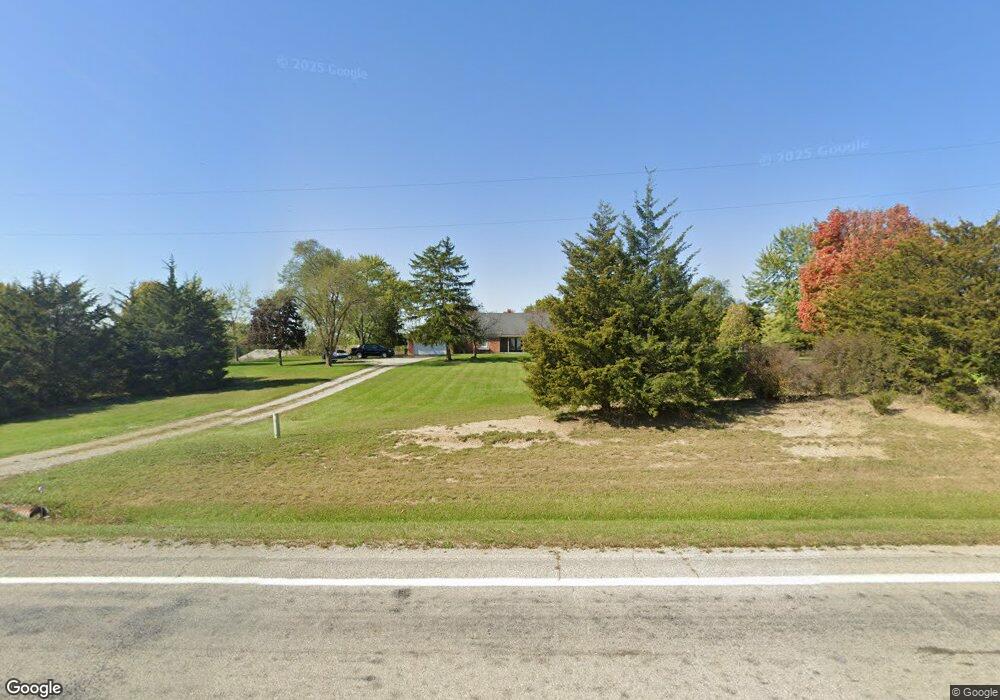
10210 N State Route 48 Covington, OH 45318
Estimated Value: $334,000 - $425,120
4
Beds
3
Baths
2,614
Sq Ft
$146/Sq Ft
Est. Value
About This Home
This home is located at 10210 N State Route 48, Covington, OH 45318 and is currently estimated at $382,780, approximately $146 per square foot. 10210 N State Route 48 is a home located in Miami County with nearby schools including Covington Elementary/Junior High School, Covington Junior High School, and Covington High School.
Ownership History
Date
Name
Owned For
Owner Type
Purchase Details
Closed on
Jul 25, 2023
Sold by
Stump Carson L and Stump Lydia
Bought by
Schilling Robert E and Schilling Viki L
Current Estimated Value
Purchase Details
Closed on
Aug 4, 2020
Sold by
Sowry Ruby Ann and Boggs Dorothy K
Bought by
Stump Carson L and Stump Lydia
Home Financials for this Owner
Home Financials are based on the most recent Mortgage that was taken out on this home.
Original Mortgage
$229,900
Interest Rate
3%
Mortgage Type
New Conventional
Purchase Details
Closed on
Feb 6, 2006
Sold by
Boggs Fred
Bought by
Boggs Dorothy K
Purchase Details
Closed on
Jan 1, 1990
Bought by
Boggs Fred
Create a Home Valuation Report for This Property
The Home Valuation Report is an in-depth analysis detailing your home's value as well as a comparison with similar homes in the area
Home Values in the Area
Average Home Value in this Area
Purchase History
| Date | Buyer | Sale Price | Title Company |
|---|---|---|---|
| Schilling Robert E | $365,000 | None Listed On Document | |
| Stump Carson L | $242,000 | None Available | |
| Boggs Dorothy K | -- | -- | |
| Boggs Fred | -- | -- |
Source: Public Records
Mortgage History
| Date | Status | Borrower | Loan Amount |
|---|---|---|---|
| Previous Owner | Stump Carson L | $229,900 |
Source: Public Records
Tax History Compared to Growth
Tax History
| Year | Tax Paid | Tax Assessment Tax Assessment Total Assessment is a certain percentage of the fair market value that is determined by local assessors to be the total taxable value of land and additions on the property. | Land | Improvement |
|---|---|---|---|---|
| 2024 | $3,570 | $106,370 | $35,740 | $70,630 |
| 2023 | $3,570 | $106,370 | $35,740 | $70,630 |
| 2022 | $3,616 | $106,370 | $35,740 | $70,630 |
| 2021 | $2,978 | $81,800 | $27,480 | $54,320 |
| 2020 | $2,667 | $81,800 | $27,480 | $54,320 |
| 2019 | $2,660 | $81,800 | $27,480 | $54,320 |
| 2018 | $2,166 | $69,270 | $20,620 | $48,650 |
| 2017 | $2,210 | $69,270 | $20,620 | $48,650 |
| 2016 | $2,122 | $69,270 | $20,620 | $48,650 |
| 2015 | $1,995 | $65,350 | $19,460 | $45,890 |
| 2014 | $1,995 | $65,350 | $19,460 | $45,890 |
| 2013 | $2,006 | $65,350 | $19,460 | $45,890 |
Source: Public Records
Map
Nearby Homes
- 5882 W Versailles Rd
- 6110 Ohio 185
- 7648 Piqua-Clayton Rd
- 2165 Stillwater Rd
- Russia-Versailles Rd
- 4528 W State Route 185
- 4510 W State Route 185
- 731 N Pearl St
- 520 N Pearl St
- 501 N Main St Unit C1
- 698 E Broadway St
- 133 W Broadway St
- 8490 Bennett Dr
- 271 N Ludlow St
- 124 N Main St
- 9145 W US Route 36
- 513 Spotted Doe Trail
- 00 W Piqua Clay Rd
- 223 Henry Ct
- 1337 Stratford Dr
- 10130 N State Route 48
- 10260 N State Route 48
- 10300 N State Route 48
- 8081 W Versailles Rd
- 8063 W Versailles Rd
- 10380 N State Route 48
- 10010 N State Route 48
- 10330 N State Route 48
- 10380 Ohio 48
- 9900 N State Route 48
- 8080 W Versailles Rd
- 10470 N State Route 48
- 8209 W Versailles Rd
- 10465 Ohio 48
- 10465 N State Route 48
- 10488 N State Route 48
- 10488 Ohio 48
- 8293 W Versailles Rd
- 10525 N State Route 48
- 9700 Ohio 48