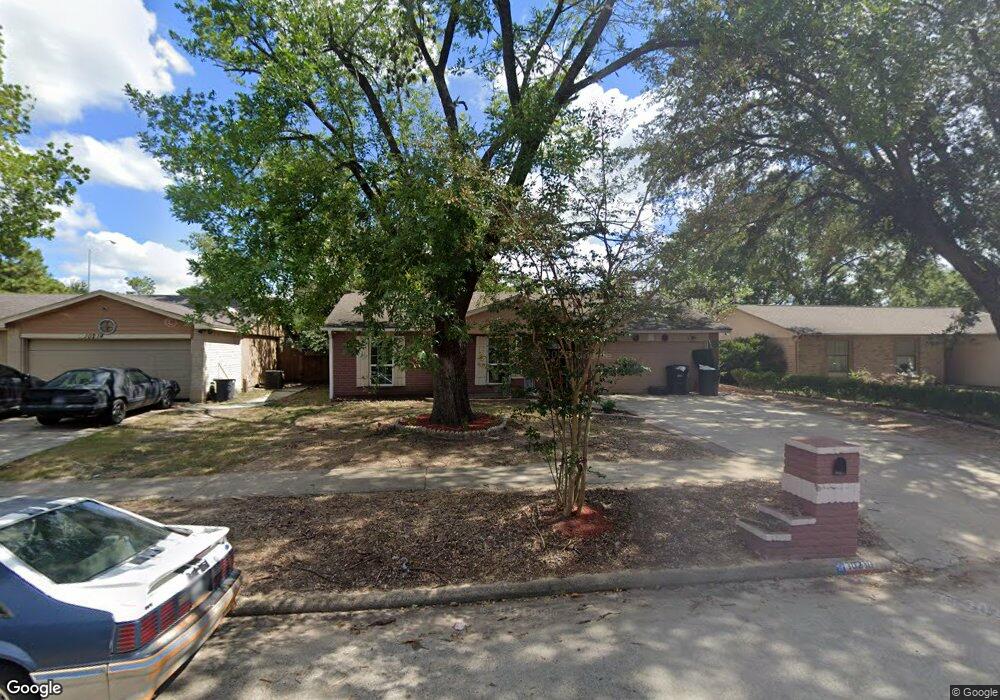
10210 Northview Dr Houston, TX 77086
North Houston NeighborhoodEstimated Value: $201,000 - $244,000
3
Beds
2
Baths
1,738
Sq Ft
$128/Sq Ft
Est. Value
About This Home
This home is located at 10210 Northview Dr, Houston, TX 77086 and is currently estimated at $223,176, approximately $128 per square foot. 10210 Northview Dr is a home located in Harris County with nearby schools including Kujawa EC/Pre-K/K School, Carmichael Elementary School, and Shotwell Middle School.
Ownership History
Date
Name
Owned For
Owner Type
Purchase Details
Closed on
May 23, 2008
Sold by
Abrego Mario A and Abrego Carmen
Bought by
Cantu Julio C and Cantu Berta I
Current Estimated Value
Purchase Details
Closed on
May 31, 2002
Sold by
Solomon Brothers Realty Corp
Bought by
Abrego Mario A and Abrego Carmen
Home Financials for this Owner
Home Financials are based on the most recent Mortgage that was taken out on this home.
Original Mortgage
$80,413
Interest Rate
6.89%
Purchase Details
Closed on
Oct 2, 2001
Sold by
Chambers Harry L and Chambers Mary Joan
Bought by
Salomon Brothers Realty Corp
Purchase Details
Closed on
Jul 3, 2001
Sold by
Chambers Harry L and Chambers Mary Joan
Bought by
Salomon Brothers Realty Corp
Purchase Details
Closed on
Feb 28, 2000
Sold by
Wick Wesley P
Bought by
Round Sam and Round Mary
Create a Home Valuation Report for This Property
The Home Valuation Report is an in-depth analysis detailing your home's value as well as a comparison with similar homes in the area
Home Values in the Area
Average Home Value in this Area
Purchase History
| Date | Buyer | Sale Price | Title Company |
|---|---|---|---|
| Cantu Julio C | -- | None Available | |
| Abrego Mario A | -- | First American Title | |
| Salomon Brothers Realty Corp | $67,760 | -- | |
| Salomon Brothers Realty Corp | $56,250 | -- | |
| Round Sam | $10,000 | -- |
Source: Public Records
Mortgage History
| Date | Status | Borrower | Loan Amount |
|---|---|---|---|
| Previous Owner | Abrego Mario A | $80,413 |
Source: Public Records
Tax History Compared to Growth
Tax History
| Year | Tax Paid | Tax Assessment Tax Assessment Total Assessment is a certain percentage of the fair market value that is determined by local assessors to be the total taxable value of land and additions on the property. | Land | Improvement |
|---|---|---|---|---|
| 2025 | $2,337 | $214,946 | $39,577 | $175,369 |
| 2024 | $2,337 | $202,192 | $39,577 | $162,615 |
| 2023 | $2,337 | $209,161 | $39,577 | $169,584 |
| 2022 | $3,107 | $173,501 | $33,540 | $139,961 |
| 2021 | $2,818 | $145,250 | $33,540 | $111,710 |
| 2020 | $2,848 | $137,841 | $33,540 | $104,301 |
| 2019 | $2,692 | $132,303 | $17,096 | $115,207 |
| 2018 | $893 | $123,536 | $17,096 | $106,440 |
| 2017 | $2,145 | $115,833 | $15,352 | $100,481 |
| 2016 | $1,950 | $105,204 | $15,352 | $89,852 |
| 2015 | $1,340 | $99,355 | $15,352 | $84,003 |
| 2014 | $1,340 | $66,267 | $15,352 | $50,915 |
Source: Public Records
Map
Nearby Homes
- 10214 Trade Winds Dr
- 6606 Dusty Dawn Dr
- 6703 Deer Ridge Ln
- 10306 Jillana Kaye Dr
- 6706 Redding Springs Ln
- 6830 Desert Rose Ln
- 6822 Dusty Dawn Dr
- 6502 Trail Valley Way
- 10730 Antoine Dr
- 10522 Northview Dr
- 6615 Winding Trace Dr
- 6911 Silver Star Dr
- 3265 Frick Rd
- 6622 Sutton Meadows Dr
- 6411 Halstead Meadows Cir
- 13518 Kaltenbrun Rd
- 6722 Winding Trace Dr
- 7011 Lower Arrow Dr
- 9815 Lonsford Dr
- 13610 Kaltenbrun Rd
- 10214 Northview Dr
- 10206 Northview Dr
- 10218 Northview Dr
- 10202 Northview Dr
- 10211 Northview Dr
- 10215 Northview Dr
- 10222 Northview Dr
- 10207 Northview Dr
- 10219 Northview Dr
- 10203 Northview Dr
- 10223 Northview Dr
- 10226 Northview Dr
- 10154 Northview Dr
- 10210 Trade Winds Dr
- 10227 Northview Dr
- 10206 Trade Winds Dr
- 10218 Trade Winds Dr
- 10230 Northview Dr
- 10202 Trade Winds Dr
- 10155 Northview Dr