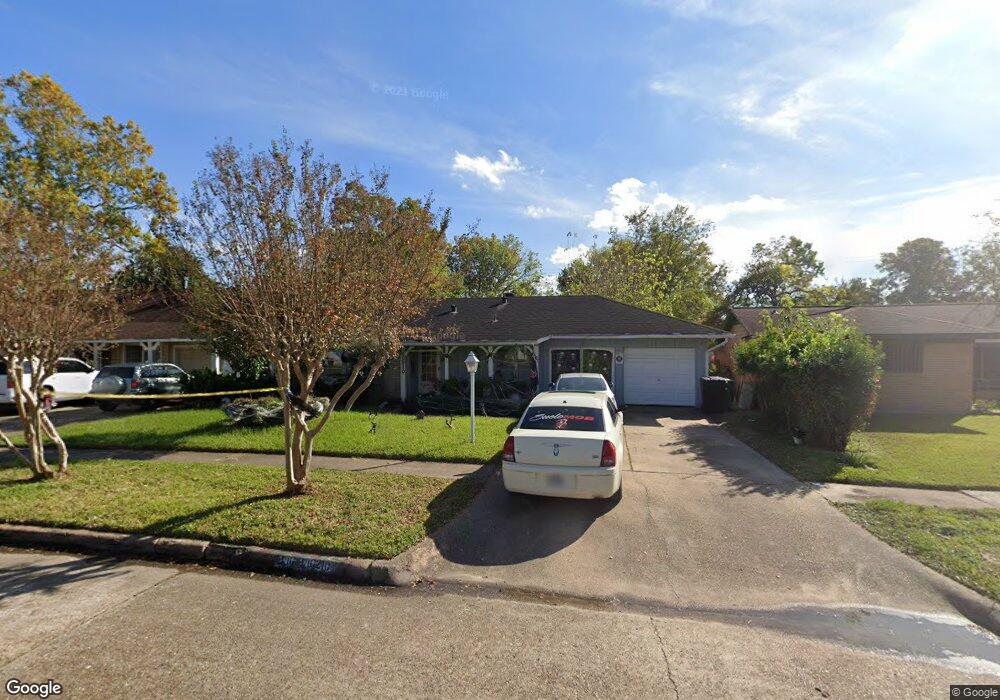
10210 Southport Dr Houston, TX 77089
Southbelt-Ellington NeighborhoodEstimated Value: $204,783 - $233,000
4
Beds
2
Baths
1,279
Sq Ft
$169/Sq Ft
Est. Value
About This Home
This home is located at 10210 Southport Dr, Houston, TX 77089 and is currently estimated at $215,946, approximately $168 per square foot. 10210 Southport Dr is a home located in Harris County with nearby schools including Meador Elementary School, Morris Middle School, and Beverly Hill Intermediate School.
Ownership History
Date
Name
Owned For
Owner Type
Purchase Details
Closed on
Jan 22, 2016
Sold by
Ornelas Ricahrd and Ornelas Martha J
Bought by
Flores Oscar G and Flores Sanjuanita
Current Estimated Value
Purchase Details
Closed on
Sep 29, 1993
Sold by
Larivee Dawn Celeste
Bought by
Ornelas Richard and Ornelas Martha J
Home Financials for this Owner
Home Financials are based on the most recent Mortgage that was taken out on this home.
Original Mortgage
$55,156
Interest Rate
6.93%
Mortgage Type
FHA
Create a Home Valuation Report for This Property
The Home Valuation Report is an in-depth analysis detailing your home's value as well as a comparison with similar homes in the area
Home Values in the Area
Average Home Value in this Area
Purchase History
| Date | Buyer | Sale Price | Title Company |
|---|---|---|---|
| Flores Oscar G | -- | Stewart Title | |
| Ornelas Richard | -- | -- |
Source: Public Records
Mortgage History
| Date | Status | Borrower | Loan Amount |
|---|---|---|---|
| Previous Owner | Ornelas Richard | $55,156 |
Source: Public Records
Tax History Compared to Growth
Tax History
| Year | Tax Paid | Tax Assessment Tax Assessment Total Assessment is a certain percentage of the fair market value that is determined by local assessors to be the total taxable value of land and additions on the property. | Land | Improvement |
|---|---|---|---|---|
| 2025 | $4,415 | $173,379 | $53,269 | $120,110 |
| 2024 | $4,415 | $176,019 | $53,269 | $122,750 |
| 2023 | $4,415 | $176,019 | $53,269 | $122,750 |
| 2022 | $4,061 | $158,626 | $53,269 | $105,357 |
| 2021 | $3,553 | $132,270 | $37,892 | $94,378 |
| 2020 | $3,450 | $125,859 | $37,111 | $88,748 |
| 2019 | $3,493 | $121,153 | $28,073 | $93,080 |
| 2018 | $1,443 | $102,833 | $27,345 | $75,488 |
| 2017 | $2,832 | $102,833 | $27,345 | $75,488 |
| 2016 | $2,572 | $93,376 | $27,345 | $66,031 |
| 2015 | $757 | $84,335 | $19,532 | $64,803 |
| 2014 | $757 | $79,736 | $19,532 | $60,204 |
Source: Public Records
Map
Nearby Homes
- 10207 Rambling Trail
- 10214 Buena Park Dr
- 10619 Wheaton Dr
- 10815 Ritow St
- 10442 Southport Dr
- 10906 Keese Dr
- 10211 Glenmawr Dr
- 11303 Caribbean Ln
- 10614 Sabo Rd
- 11311 Caribbean Ln
- 10018 Ramey St
- 9743 Santa Monica Blvd
- 10823 Overlea Dr
- 9914 Sumerlin St
- 9711 Ebb St
- 10147 Torrington Ln
- 10906 Green Arbor Dr
- 9811 Mango St
- 9721 Foredale St
- 11433 Sabo Rd
- 10206 Southport Dr
- 10214 Southport Dr
- 10211 Fuqua St
- 10202 Southport Dr
- 10207 Fuqua St
- 10215 Fuqua St
- 10218 Southport Dr
- 10215 Southport Dr
- 10203 Fuqua St
- 10219 Fuqua St
- 10202 Rambling Trail
- 10223 Fuqua St
- 10222 Southport Dr
- 10210 Rambling Trail
- 10219 Southport Dr
- 10626 Members Dr
- 10214 Rambling Trail
- 10227 Fuqua St
- 10302 Southport Dr
- 10139 Fuqua St