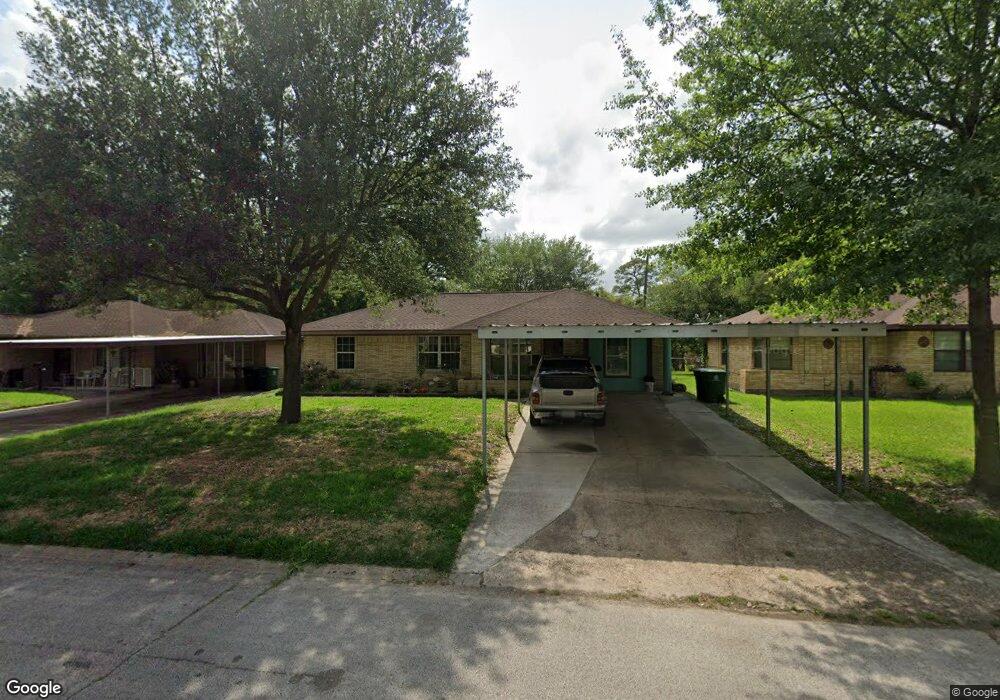
10213 Envoy St Houston, TX 77016
East Little York NeighborhoodEstimated Value: $180,549 - $255,000
5
Beds
3
Baths
2,527
Sq Ft
$80/Sq Ft
Est. Value
About This Home
This home is located at 10213 Envoy St, Houston, TX 77016 and is currently estimated at $202,637, approximately $80 per square foot. 10213 Envoy St is a home located in Harris County with nearby schools including Shadydale Elementary School, Forest Brook Middle, and North Forest High School.
Ownership History
Date
Name
Owned For
Owner Type
Purchase Details
Closed on
Dec 1, 2017
Sold by
Villarreal Oliver
Bought by
Villarreal Ramon and Villarreal Cristina
Current Estimated Value
Purchase Details
Closed on
Jan 30, 2007
Sold by
Us Bank Na
Bought by
Villarreal Oliver
Purchase Details
Closed on
Oct 3, 2006
Sold by
Kyles Amanda Goins and Kyles Brian E
Bought by
U S Bank Na
Purchase Details
Closed on
May 16, 2005
Sold by
Burnett Brenda Joyce
Bought by
Kyles Brian E
Home Financials for this Owner
Home Financials are based on the most recent Mortgage that was taken out on this home.
Original Mortgage
$48,000
Interest Rate
9.35%
Mortgage Type
Fannie Mae Freddie Mac
Purchase Details
Closed on
Sep 16, 1994
Sold by
Moren Doris N and Moren Oren L
Bought by
Burnett Brenda Joyce
Home Financials for this Owner
Home Financials are based on the most recent Mortgage that was taken out on this home.
Original Mortgage
$25,000
Interest Rate
8.36%
Create a Home Valuation Report for This Property
The Home Valuation Report is an in-depth analysis detailing your home's value as well as a comparison with similar homes in the area
Home Values in the Area
Average Home Value in this Area
Purchase History
| Date | Buyer | Sale Price | Title Company |
|---|---|---|---|
| Villarreal Ramon | -- | None Available | |
| Villarreal Oliver | -- | First American Title | |
| U S Bank Na | $48,000 | None Available | |
| Kyles Brian E | -- | Southern American Title | |
| Burnett Brenda Joyce | -- | Texas American Title Company |
Source: Public Records
Mortgage History
| Date | Status | Borrower | Loan Amount |
|---|---|---|---|
| Previous Owner | Kyles Brian E | $48,000 | |
| Previous Owner | Burnett Brenda Joyce | $25,000 |
Source: Public Records
Tax History Compared to Growth
Tax History
| Year | Tax Paid | Tax Assessment Tax Assessment Total Assessment is a certain percentage of the fair market value that is determined by local assessors to be the total taxable value of land and additions on the property. | Land | Improvement |
|---|---|---|---|---|
| 2025 | $4,119 | $246,968 | $54,570 | $192,398 |
| 2024 | $4,119 | $196,882 | $38,520 | $158,362 |
| 2023 | $4,119 | $170,528 | $38,520 | $132,008 |
| 2022 | $3,547 | $161,087 | $38,520 | $122,567 |
| 2021 | $3,023 | $129,697 | $25,680 | $104,017 |
| 2020 | $2,679 | $110,649 | $17,334 | $93,315 |
| 2019 | $2,210 | $87,325 | $10,978 | $76,347 |
| 2018 | $1,767 | $69,824 | $10,978 | $58,846 |
| 2017 | $1,276 | $69,824 | $10,978 | $58,846 |
| 2016 | $1,160 | $65,544 | $10,978 | $54,566 |
| 2015 | $603 | $62,291 | $10,978 | $51,313 |
| 2014 | $603 | $42,628 | $10,978 | $31,650 |
Source: Public Records
Map
Nearby Homes
- 10221 Bretton Dr
- 6001 Bretshire Dr
- 10122 Rockaway Dr
- 10201 Homestead Rd
- 10434 Envoy St
- 10806 Bird of Paradise Ln
- 10808 Bird of Paradise Ln
- 10810 Bird of Paradise Ln
- 10128 Homestead Rd
- 10124 Homestead Rd
- 10120 Homestead Rd
- 10430 Royal Oaks Dr
- 10317 Kelburn Dr
- 7210 Colton St
- 10526 Hollyglen Dr
- 10535 Hollyglen Dr
- 7234 Boggess Rd
- 7226 Gore Dr
- 10538 Royal Oaks Dr
- 7220 Parker Rd
- 10209 Envoy St
- 10217 Envoy St
- 10310 Wolbrook St
- 10221 Envoy St
- 10205 Envoy St
- 10314 Wolbrook St
- 10214 Envoy St
- 5905 Bretshire Dr
- 10218 Envoy St
- 10210 Envoy St
- 10225 Envoy St
- 5901 Bretshire Dr
- 5909 Bretshire Dr
- 10222 Envoy St
- 10206 Envoy St
- 10318 Wolbrook St
- 10229 Envoy St
- 10226 Envoy St
- 10202 Envoy St
- 10322 Wolbrook St