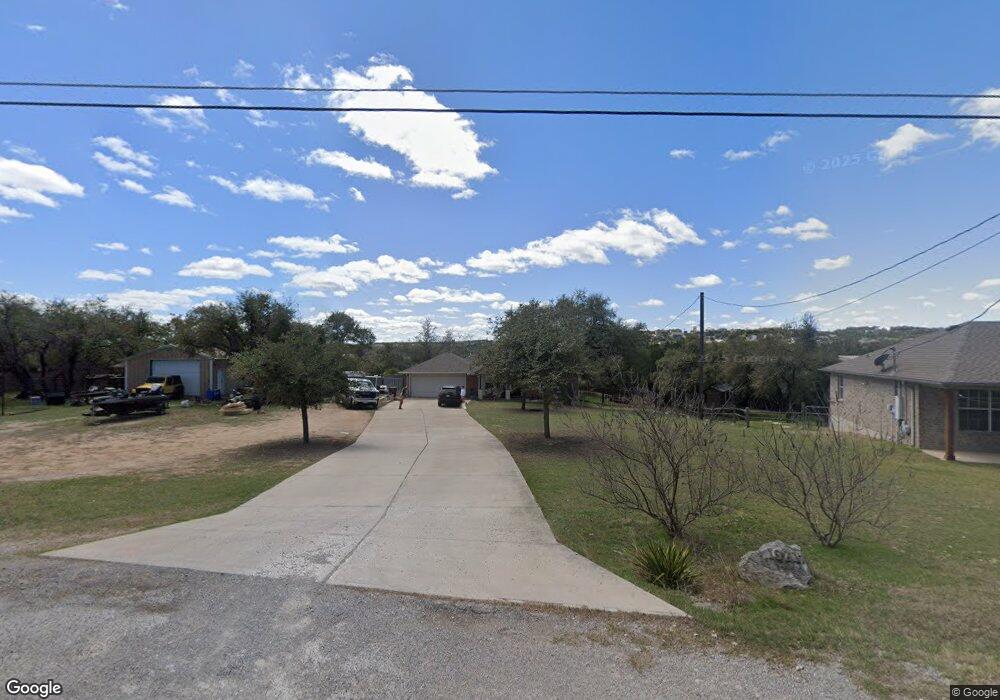
10214 Thomas Ln Dripping Springs, TX 78620
Hamilton Pool NeighborhoodEstimated Value: $425,000 - $622,000
--
Bed
2
Baths
2,055
Sq Ft
$253/Sq Ft
Est. Value
About This Home
This home is located at 10214 Thomas Ln, Dripping Springs, TX 78620 and is currently estimated at $519,493, approximately $252 per square foot. 10214 Thomas Ln is a home located in Travis County with nearby schools including Bee Cave Elementary School, Bee Cave Middle School, and Lake Travis High School.
Ownership History
Date
Name
Owned For
Owner Type
Purchase Details
Closed on
Oct 22, 2015
Sold by
Ussery Linda and Ussery Buddy
Bought by
Ussery Krystal Farmer and Ussery Buddy Michael
Current Estimated Value
Purchase Details
Closed on
Jul 11, 2012
Sold by
Ussery Buddy and Ussery Linda
Bought by
Ussery Krystal and Ussery Michael
Home Financials for this Owner
Home Financials are based on the most recent Mortgage that was taken out on this home.
Original Mortgage
$161,700
Outstanding Balance
$112,251
Interest Rate
3.79%
Mortgage Type
New Conventional
Estimated Equity
$407,242
Purchase Details
Closed on
Aug 17, 2007
Sold by
Hans Shane and Hans Michelle D
Bought by
Ussery Buddy and Ussery Linda
Home Financials for this Owner
Home Financials are based on the most recent Mortgage that was taken out on this home.
Original Mortgage
$164,700
Interest Rate
6.64%
Mortgage Type
Purchase Money Mortgage
Purchase Details
Closed on
Feb 6, 2003
Sold by
Doran Jimmy G and Doran Betty E
Bought by
Hans Shane and Dorsogna Michelle
Create a Home Valuation Report for This Property
The Home Valuation Report is an in-depth analysis detailing your home's value as well as a comparison with similar homes in the area
Home Values in the Area
Average Home Value in this Area
Purchase History
| Date | Buyer | Sale Price | Title Company |
|---|---|---|---|
| Ussery Krystal Farmer | -- | Gracy Title | |
| Ussery Krystal | -- | None Available | |
| Ussery Buddy | -- | None Available | |
| Hans Shane | -- | Stewart Title |
Source: Public Records
Mortgage History
| Date | Status | Borrower | Loan Amount |
|---|---|---|---|
| Open | Ussery Krystal | $161,700 | |
| Closed | Ussery Buddy | $164,700 |
Source: Public Records
Tax History Compared to Growth
Tax History
| Year | Tax Paid | Tax Assessment Tax Assessment Total Assessment is a certain percentage of the fair market value that is determined by local assessors to be the total taxable value of land and additions on the property. | Land | Improvement |
|---|---|---|---|---|
| 2025 | $6,362 | $503,808 | $132,941 | $370,867 |
| 2023 | $6,475 | $523,692 | $0 | $0 |
| 2022 | $8,677 | $505,757 | $0 | $0 |
| 2021 | $6,695 | $372,082 | $112,000 | $277,900 |
| 2020 | $6,159 | $322,058 | $32,000 | $290,058 |
| 2018 | $6,251 | $315,097 | $32,000 | $283,097 |
| 2017 | $4,696 | $234,602 | $32,000 | $206,940 |
| 2016 | $4,308 | $215,225 | $32,000 | $189,120 |
| 2015 | $3,233 | $152,636 | $50,750 | $159,372 |
| 2014 | $3,233 | $173,000 | $18,000 | $155,000 |
Source: Public Records
Map
Nearby Homes
- 10300 Little Creek Cir
- 10213 Thomas Ln
- 10107 George Hill Dr
- 10103 George Hill Dr
- 10013 Little Creek Cir
- 10006 George Hill Dr
- 17503 Lake Shore Dr
- 17110 Oak Cliff Cir
- 17601 Lake Shore Dr
- 17201 Oak Cliff Cir
- 17610 Village Dr
- 10129 Longhorn Skyway
- 10511 Lake Park Dr
- 10722 Lake Park Dr
- 10627 Lake Park Dr
- 17837 Panorama Dr
- 10624 Lake Park Dr
- 10806 Glenview Cir
- 10802 & 10804 Timber Cir
- 10115 Longhorn Skyway
- 10216 Thomas Ln
- 10210 Little Creek Cir
- 10212 Thomas Ln
- 10212 Little Creek Cir
- 10218 Thomas Ln
- 10208 Thomas Ln
- 10210 Thomas Ln
- 10220 Thomas Ln
- 10209 Thomas Ln
- 10211 Thomas Ln
- 10302 Little Creek Cir
- 17200 Lake Shore Dr
- 10206 Thomas Ln
- 17200 Lakeshore Dr
- 10207 Thomas Ln
- 17204 Lakeshore Dr
- 17204 Lake Shore Dr
- 17300 Lakeshore Dr
- 10301 Lake Beach Dr
- 10205 Thomas Ln