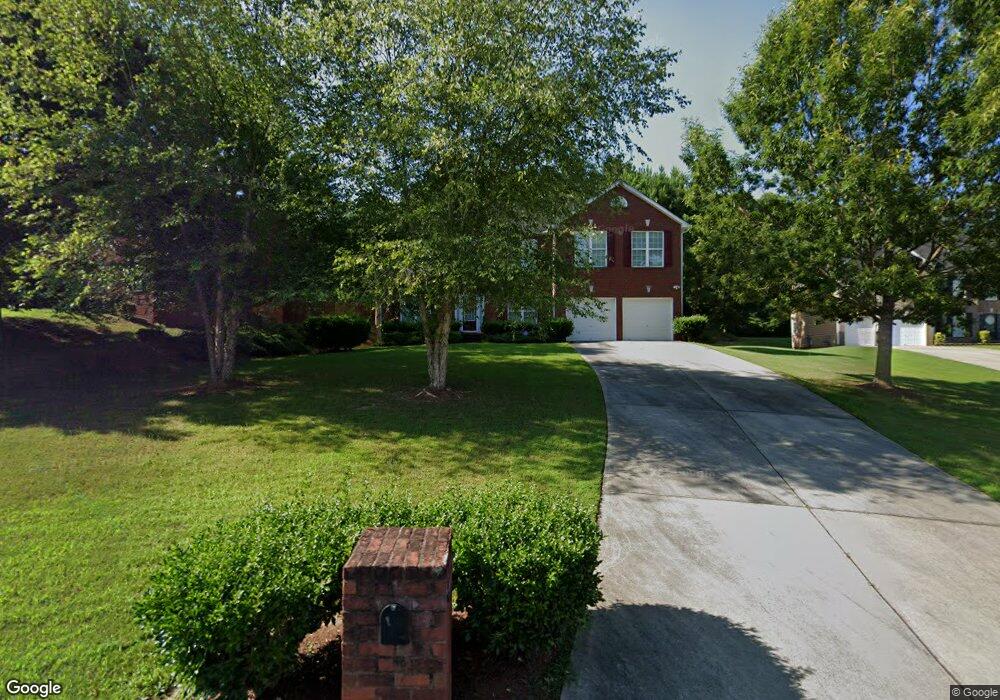
10216 Hemlock Way Jonesboro, GA 30238
Estimated Value: $350,351 - $383,000
4
Beds
3
Baths
2,800
Sq Ft
$133/Sq Ft
Est. Value
About This Home
This home is located at 10216 Hemlock Way, Jonesboro, GA 30238 and is currently estimated at $371,088, approximately $132 per square foot. 10216 Hemlock Way is a home located in Clayton County with nearby schools including Hawthorne Elementary School, Eddie White Academy, and Lovejoy Middle School.
Ownership History
Date
Name
Owned For
Owner Type
Purchase Details
Closed on
Jul 15, 2022
Sold by
Abrahams Bernice
Bought by
Jordan Willie Clyde
Current Estimated Value
Home Financials for this Owner
Home Financials are based on the most recent Mortgage that was taken out on this home.
Original Mortgage
$379,000
Outstanding Balance
$361,213
Interest Rate
5.78%
Mortgage Type
VA
Estimated Equity
$9,875
Purchase Details
Closed on
Apr 22, 2019
Sold by
Abrahams Verol
Bought by
Abrahams Bernice
Purchase Details
Closed on
Nov 1, 2005
Sold by
First Dimension Homes Inc
Bought by
Abrahams Verol
Home Financials for this Owner
Home Financials are based on the most recent Mortgage that was taken out on this home.
Original Mortgage
$196,650
Interest Rate
8.25%
Mortgage Type
New Conventional
Create a Home Valuation Report for This Property
The Home Valuation Report is an in-depth analysis detailing your home's value as well as a comparison with similar homes in the area
Home Values in the Area
Average Home Value in this Area
Purchase History
| Date | Buyer | Sale Price | Title Company |
|---|---|---|---|
| Jordan Willie Clyde | $379,000 | -- | |
| Abrahams Bernice | -- | -- | |
| Abrahams Verol | $207,000 | -- |
Source: Public Records
Mortgage History
| Date | Status | Borrower | Loan Amount |
|---|---|---|---|
| Open | Jordan Willie Clyde | $379,000 | |
| Previous Owner | Abrahams Verol | $196,650 |
Source: Public Records
Tax History Compared to Growth
Tax History
| Year | Tax Paid | Tax Assessment Tax Assessment Total Assessment is a certain percentage of the fair market value that is determined by local assessors to be the total taxable value of land and additions on the property. | Land | Improvement |
|---|---|---|---|---|
| 2025 | $396 | $131,160 | $9,600 | $121,560 |
| 2024 | $590 | $131,160 | $9,600 | $121,560 |
| 2023 | $4,529 | $125,440 | $9,600 | $115,840 |
| 2022 | $3,416 | $96,080 | $9,600 | $86,480 |
| 2021 | $2,858 | $81,400 | $9,600 | $71,800 |
| 2020 | $2,715 | $76,939 | $9,600 | $67,339 |
| 2019 | $2,324 | $66,312 | $9,600 | $56,712 |
| 2018 | $1,990 | $58,088 | $9,600 | $48,488 |
| 2017 | $1,889 | $55,496 | $9,600 | $45,896 |
| 2016 | $1,566 | $47,553 | $9,600 | $37,953 |
| 2015 | $1,557 | $0 | $0 | $0 |
| 2014 | $1,436 | $45,140 | $9,600 | $35,540 |
Source: Public Records
Map
Nearby Homes
- 315 Coverview Ct
- 338 Lead Way
- 9716 Holly Hill Way
- 366 Lead Way
- 442 Hastings Way
- 603 Hastings Way
- 696 Tara Rd
- 10588 Fitzgerald Rd
- LOT Hunter Ridge Dr
- 0 Highway 54 Unit 10613856
- 709 Willow Bend Dr
- 800 Sinclair Way
- 9579 Fayetteville Rd
- 9579 Highway 54 W
- 10411 Ivygate Terrace
- 10820 Lees Ct
- 7878 Waterwheel Way
- 9502 Whaleys Lake Trace
- 8922 Hwy 54 W
- 1506 Mundys Mill Rd
- 10208 Hemlock Way
- 10224 Hemlock Way
- 10200 Hemlock Way
- 10228 Hemlock Way
- 10223 Hemlock Way
- 10207 Hemlock Way
- 10192 Hemlock Way
- 10199 Hemlock Way
- 10215 Hemlock Way
- 10229 Hemlock Way
- 10167 Hickory Cir
- 10175 Hemlock Way Unit 24
- 10147 Hemlock Way
- 10173 Hickory Cir
- 312 Coverview Ct
- 312 Coverview Ct Unit 27
- 304 Coverview Ct Unit 26
- 10172 Hickory Cir
- 10172 Hickory Cir Unit 38
- 316 Coverview Ct