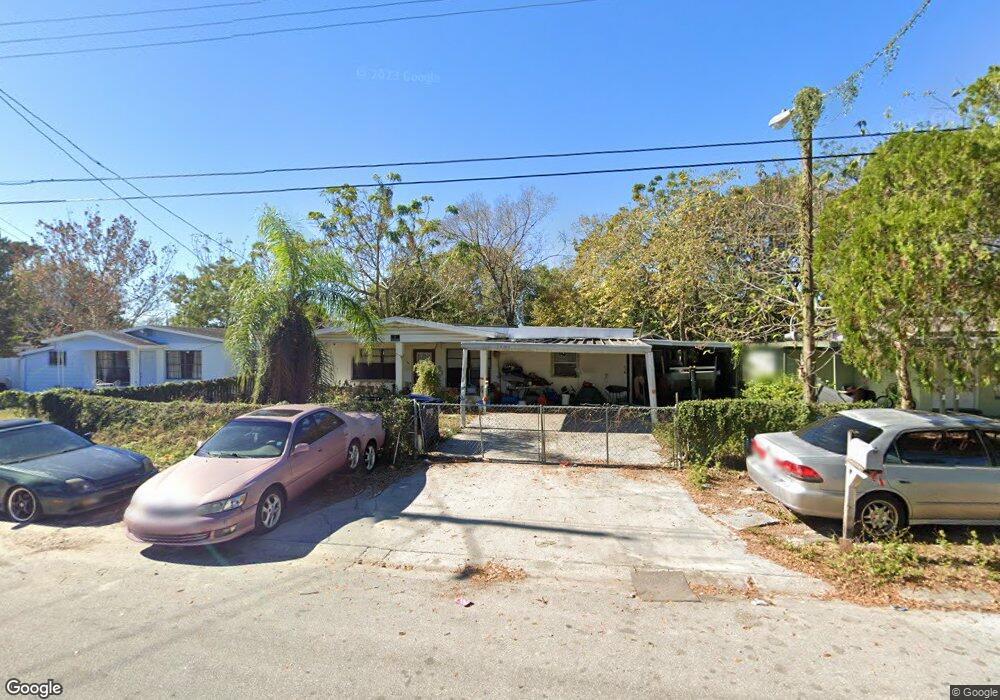
10218 N 29th St Tampa, FL 33612
North Tampa NeighborhoodEstimated Value: $220,000 - $325,000
2
Beds
1
Bath
1,200
Sq Ft
$233/Sq Ft
Est. Value
About This Home
This home is located at 10218 N 29th St, Tampa, FL 33612 and is currently estimated at $280,120, approximately $233 per square foot. 10218 N 29th St is a home located in Hillsborough County with nearby schools including DR Carter G Woodson K-8 School, Wharton High School, and New Springs Schools.
Ownership History
Date
Name
Owned For
Owner Type
Purchase Details
Closed on
Jun 23, 2005
Sold by
Va
Bought by
Temal Rickie and Temal Rosanna
Current Estimated Value
Home Financials for this Owner
Home Financials are based on the most recent Mortgage that was taken out on this home.
Original Mortgage
$78,399
Outstanding Balance
$40,771
Interest Rate
5.7%
Mortgage Type
New Conventional
Estimated Equity
$239,349
Purchase Details
Closed on
Nov 12, 2004
Sold by
Ruth Jeffery Franklin
Bought by
Va
Purchase Details
Closed on
Oct 24, 2000
Sold by
Kinard Micahel L and Kinard J
Bought by
Ruth Jeffery F
Home Financials for this Owner
Home Financials are based on the most recent Mortgage that was taken out on this home.
Original Mortgage
$76,602
Interest Rate
7.96%
Mortgage Type
VA
Purchase Details
Closed on
Dec 22, 1993
Sold by
Scaglione J John
Bought by
Kinard Michael L and Kinard Betty J
Home Financials for this Owner
Home Financials are based on the most recent Mortgage that was taken out on this home.
Original Mortgage
$45,000
Interest Rate
7.09%
Create a Home Valuation Report for This Property
The Home Valuation Report is an in-depth analysis detailing your home's value as well as a comparison with similar homes in the area
Home Values in the Area
Average Home Value in this Area
Purchase History
| Date | Buyer | Sale Price | Title Company |
|---|---|---|---|
| Temal Rickie | $98,000 | Bay Area Title Inc | |
| Va | -- | -- | |
| Ruth Jeffery F | $75,100 | -- | |
| Kinard Michael L | -- | -- |
Source: Public Records
Mortgage History
| Date | Status | Borrower | Loan Amount |
|---|---|---|---|
| Open | Temal Rickie | $78,399 | |
| Previous Owner | Ruth Jeffery F | $76,602 | |
| Previous Owner | Ruth Jeffery F | $22,800 | |
| Previous Owner | Kinard Michael L | $45,000 |
Source: Public Records
Tax History Compared to Growth
Tax History
| Year | Tax Paid | Tax Assessment Tax Assessment Total Assessment is a certain percentage of the fair market value that is determined by local assessors to be the total taxable value of land and additions on the property. | Land | Improvement |
|---|---|---|---|---|
| 2024 | $3,600 | $207,863 | $49,934 | $157,929 |
| 2023 | $3,430 | $209,061 | $46,814 | $162,247 |
| 2022 | $3,225 | $201,125 | $40,572 | $160,553 |
| 2021 | $2,859 | $153,755 | $25,903 | $127,852 |
| 2020 | $2,587 | $132,326 | $19,662 | $112,664 |
| 2019 | $2,377 | $119,914 | $18,725 | $101,189 |
| 2018 | $2,209 | $110,310 | $0 | $0 |
| 2017 | $1,978 | $91,412 | $0 | $0 |
| 2016 | $1,744 | $75,004 | $0 | $0 |
| 2015 | $1,554 | $68,185 | $0 | $0 |
| 2014 | $1,439 | $64,696 | $0 | $0 |
| 2013 | -- | $58,815 | $0 | $0 |
Source: Public Records
Map
Nearby Homes
- 10007 N 26th St
- 10015 N 25th St
- 10208 Lola St
- 10220 N 23rd St
- 2603 E 110th Ave
- 2329 E 110th Ave
- 10009 N 22nd St
- 2110 E Poinsettia Ave
- 2108 E Linebaugh Ave
- 10104 N 21st St
- 2415 E Annie St
- 2800 E 113th Ave Unit 115
- 1905 Meridel Ave
- 2428 N Ramona Cir
- 1807 E Bougainvillea Ave
- 1817 Meridel Ave
- 1801 E Poinsettia Ave
- 2102 E Annie St
- 2008 E Annie St
- 1806 Marvy Ave
- 10216 N 29th St
- 10220 N 29th St
- 10211 N 28th St
- 10209 N 28th St
- 10213 N 28th St
- 10214 N 29th St
- 10222 N 29th St
- 10219 N 29th St
- 10207 N 28th St
- 10215 N 28th St
- 10217 N 29th St
- 10221 N 29th St
- 10224 N 29th St
- 10212 N 29th St
- 10215 N 29th St
- 10223 N 29th St
- 10217 N 28th St
- 10205 N 28th St
- 10213 N 29th St
- 10225 N 29th St