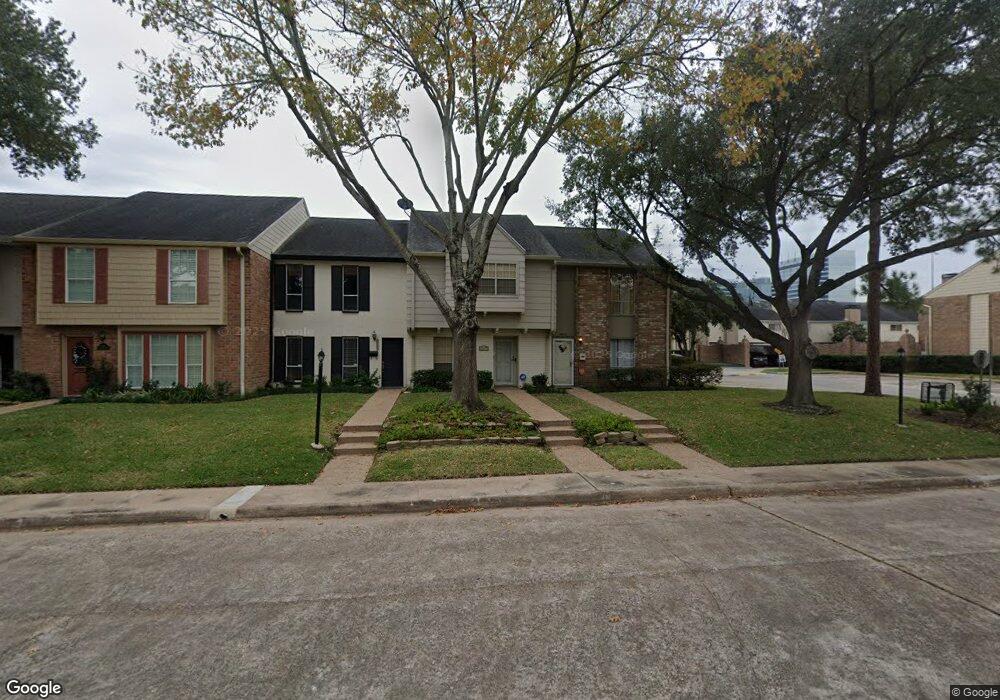
10219 Longmont Dr Unit 36 Houston, TX 77042
Briar Forest NeighborhoodEstimated Value: $223,662 - $248,000
2
Beds
3
Baths
1,320
Sq Ft
$178/Sq Ft
Est. Value
About This Home
This home is located at 10219 Longmont Dr Unit 36, Houston, TX 77042 and is currently estimated at $235,416, approximately $178 per square foot. 10219 Longmont Dr Unit 36 is a home located in Harris County with nearby schools including Walnut Bend Elementary School, Paul Revere Middle School, and Westside High School.
Ownership History
Date
Name
Owned For
Owner Type
Purchase Details
Closed on
Jul 15, 2008
Sold by
Merten Francis J and Merten Janice L
Bought by
Calvey Linda L
Current Estimated Value
Purchase Details
Closed on
Mar 17, 2005
Sold by
Kirby Carolyn Lee and Ryan Daniel P
Bought by
Merten Francis Joe and Merten Janice Lou
Home Financials for this Owner
Home Financials are based on the most recent Mortgage that was taken out on this home.
Original Mortgage
$99,000
Interest Rate
5.67%
Mortgage Type
Purchase Money Mortgage
Purchase Details
Closed on
Oct 19, 2004
Sold by
Kirby Carolyn Lee
Bought by
Ryan Daniel P and Kirby Carolyn Lee
Home Financials for this Owner
Home Financials are based on the most recent Mortgage that was taken out on this home.
Original Mortgage
$93,600
Interest Rate
5.73%
Mortgage Type
Stand Alone Refi Refinance Of Original Loan
Create a Home Valuation Report for This Property
The Home Valuation Report is an in-depth analysis detailing your home's value as well as a comparison with similar homes in the area
Home Values in the Area
Average Home Value in this Area
Purchase History
| Date | Buyer | Sale Price | Title Company |
|---|---|---|---|
| Calvey Linda L | -- | Stewart Title Houston Div | |
| Merten Francis Joe | -- | Fidelity National Title | |
| Ryan Daniel P | -- | Fidelity National Title |
Source: Public Records
Mortgage History
| Date | Status | Borrower | Loan Amount |
|---|---|---|---|
| Previous Owner | Merten Francis Joe | $99,000 | |
| Previous Owner | Ryan Daniel P | $93,600 |
Source: Public Records
Tax History Compared to Growth
Tax History
| Year | Tax Paid | Tax Assessment Tax Assessment Total Assessment is a certain percentage of the fair market value that is determined by local assessors to be the total taxable value of land and additions on the property. | Land | Improvement |
|---|---|---|---|---|
| 2025 | $15 | $188,351 | $65,000 | $123,351 |
| 2024 | $15 | $181,372 | $65,000 | $116,372 |
| 2023 | $15 | $187,888 | $65,000 | $122,888 |
| 2022 | $3,689 | $168,274 | $65,000 | $103,274 |
| 2021 | $3,550 | $152,313 | $65,000 | $87,313 |
| 2020 | $4,072 | $168,148 | $65,000 | $103,148 |
| 2019 | $4,255 | $168,148 | $65,000 | $103,148 |
| 2018 | $519 | $163,994 | $65,000 | $98,994 |
| 2017 | $3,771 | $157,065 | $65,000 | $92,065 |
| 2016 | $3,428 | $149,155 | $65,000 | $84,155 |
| 2015 | $683 | $143,269 | $65,000 | $78,269 |
| 2014 | $683 | $121,703 | $37,500 | $84,203 |
Source: Public Records
Map
Nearby Homes
- 10212 Longmont Dr Unit 44/7
- 10378 Briar Forest Dr Unit 32/5
- 10324 Briar Forest Dr Unit 28
- 10276 Briar Forest Dr Unit 25
- 10121 Valley Forge Dr
- 10317 Briar Forest Dr Unit 214
- 10118 Briar Rose Dr
- 1537 W Sam Houston Pkwy S
- 10034 Bordley Dr
- 10042 Briar Forest Dr
- 10034 Briar Forest Dr
- 1691 W Sam Houston Pkwy S
- 10323 Pine Forest Rd
- 10010 Bordley Dr
- 1003 Blue Willow Dr
- 10303 Chevy Chase Dr
- 10031 Inwood Dr
- 10614 Lynbrook Dr
- 10211 Olympia Dr
- 10615 Briar Forest Dr Unit 104
- 10217 Longmont Dr Unit 36
- 10217 Longmont Dr Unit 3
- 10215 Longmont Dr Unit 4
- 10221 Longmont Dr Unit 36
- 10213 Longmont Dr Unit 36
- 10211 Longmont Dr Unit 36
- 10209 Longmont Dr Unit 36
- 10207 Longmont Dr Unit 36
- 10205 Longmont Dr Unit 36
- 10241 Longmont Dr Unit 34
- 10241 Longmont Dr Unit 34/9
- 10241 Longmont Dr Unit 9
- 10243 Longmont Dr Unit 34
- 10243 Longmont Dr Unit 10
- 10243 Longmont Dr Unit 34/10
- 10245 Longmont Dr Unit 34
- 10239 Longmont Dr Unit 34
- 10303 Longmont Dr Unit 37
- 10303 Longmont Dr Unit 1
- 10247 Longmont Dr Unit 34