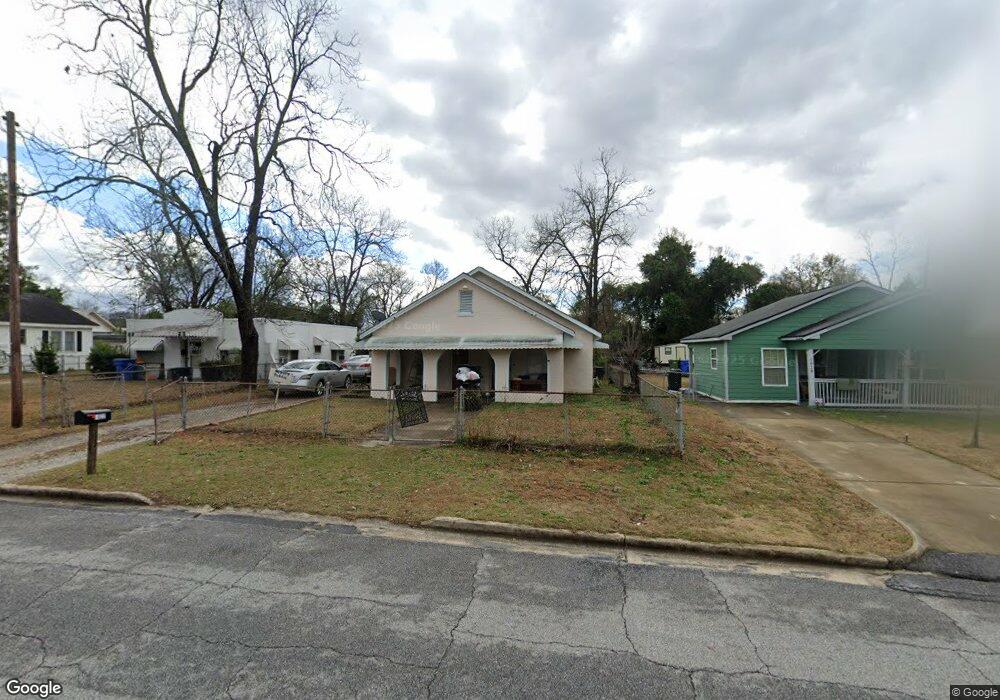
1022 39th St Columbus, GA 31904
North Highlands NeighborhoodEstimated Value: $83,000 - $122,207
3
Beds
3
Baths
1,792
Sq Ft
$55/Sq Ft
Est. Value
About This Home
This home is located at 1022 39th St, Columbus, GA 31904 and is currently estimated at $98,802, approximately $55 per square foot. 1022 39th St is a home located in Muscogee County with nearby schools including Johnson Elementary School, Arnold Middle School, and Jordan Vocational High School.
Ownership History
Date
Name
Owned For
Owner Type
Purchase Details
Closed on
Jun 10, 2024
Sold by
Sapp Bobbie
Bought by
Sapp Richard Alan
Current Estimated Value
Purchase Details
Closed on
Jun 19, 2014
Sold by
Loud Rebecca Blackburn
Bought by
Sapp Bobbie
Home Financials for this Owner
Home Financials are based on the most recent Mortgage that was taken out on this home.
Original Mortgage
$33,000
Interest Rate
4.19%
Mortgage Type
New Conventional
Create a Home Valuation Report for This Property
The Home Valuation Report is an in-depth analysis detailing your home's value as well as a comparison with similar homes in the area
Home Values in the Area
Average Home Value in this Area
Purchase History
| Date | Buyer | Sale Price | Title Company |
|---|---|---|---|
| Sapp Richard Alan | -- | None Listed On Document | |
| Sapp Bobbie | $48,000 | -- |
Source: Public Records
Mortgage History
| Date | Status | Borrower | Loan Amount |
|---|---|---|---|
| Previous Owner | Sapp Bobbie | $33,000 |
Source: Public Records
Tax History Compared to Growth
Tax History
| Year | Tax Paid | Tax Assessment Tax Assessment Total Assessment is a certain percentage of the fair market value that is determined by local assessors to be the total taxable value of land and additions on the property. | Land | Improvement |
|---|---|---|---|---|
| 2025 | $1,134 | $28,972 | $5,428 | $23,544 |
| 2024 | $1,168 | $28,972 | $5,428 | $23,544 |
| 2023 | $1,141 | $28,972 | $5,428 | $23,544 |
| 2022 | $756 | $18,508 | $3,800 | $14,708 |
| 2021 | $688 | $16,840 | $3,800 | $13,040 |
| 2020 | $688 | $16,840 | $3,800 | $13,040 |
| 2019 | $690 | $16,840 | $3,800 | $13,040 |
| 2018 | $690 | $16,840 | $3,800 | $13,040 |
| 2017 | $939 | $22,840 | $3,800 | $19,040 |
| 2016 | $792 | $19,200 | $1,932 | $17,268 |
| 2015 | $317 | $19,200 | $1,932 | $17,268 |
| 2014 | $4 | $11,842 | $1,932 | $9,910 |
| 2013 | -- | $11,842 | $1,932 | $9,910 |
Source: Public Records
Map
Nearby Homes