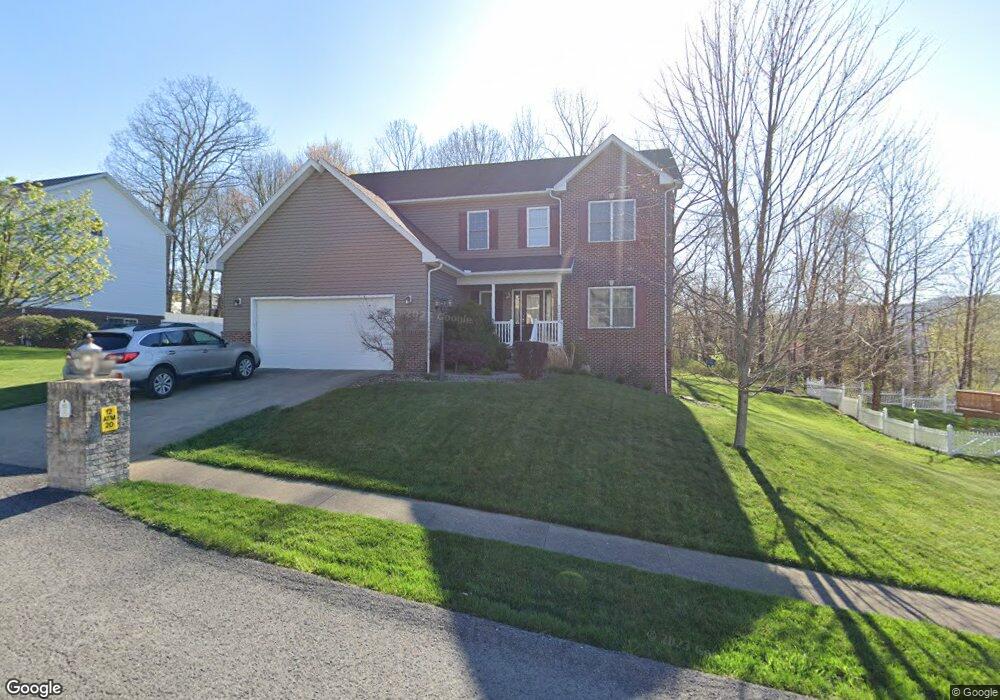
1022 Autumn Ave Morgantown, WV 26508
Brookhaven NeighborhoodEstimated Value: $470,552 - $543,000
4
Beds
3
Baths
3,630
Sq Ft
$139/Sq Ft
Est. Value
About This Home
This home is located at 1022 Autumn Ave, Morgantown, WV 26508 and is currently estimated at $504,388, approximately $138 per square foot. 1022 Autumn Ave is a home located in Monongalia County with nearby schools including Brookhaven Elementary School, South Middle School, and Morgantown High School.
Ownership History
Date
Name
Owned For
Owner Type
Purchase Details
Closed on
Jun 26, 2018
Sold by
Friggens Karen Bernice and Friggens Brian Joseph
Bought by
Hunter Scott and Hunter Radomira
Current Estimated Value
Home Financials for this Owner
Home Financials are based on the most recent Mortgage that was taken out on this home.
Original Mortgage
$260,000
Outstanding Balance
$225,827
Interest Rate
4.6%
Mortgage Type
New Conventional
Estimated Equity
$278,561
Purchase Details
Closed on
Jun 22, 2010
Sold by
Koop George A and Kopp Norma J
Bought by
Friggens Brian Joseph and Friggens Karen Bernice
Home Financials for this Owner
Home Financials are based on the most recent Mortgage that was taken out on this home.
Original Mortgage
$301,342
Interest Rate
4.78%
Mortgage Type
VA
Purchase Details
Closed on
Jul 20, 2005
Sold by
Mcalister Sean
Bought by
Kopp Noma J and Kopp George A
Home Financials for this Owner
Home Financials are based on the most recent Mortgage that was taken out on this home.
Original Mortgage
$231,200
Interest Rate
5.62%
Mortgage Type
Adjustable Rate Mortgage/ARM
Create a Home Valuation Report for This Property
The Home Valuation Report is an in-depth analysis detailing your home's value as well as a comparison with similar homes in the area
Home Values in the Area
Average Home Value in this Area
Purchase History
| Date | Buyer | Sale Price | Title Company |
|---|---|---|---|
| Hunter Scott | $360,000 | None Available | |
| Friggens Brian Joseph | $295,000 | None Available | |
| Kopp Noma J | $289,000 | None Available |
Source: Public Records
Mortgage History
| Date | Status | Borrower | Loan Amount |
|---|---|---|---|
| Open | Hunter Scott | $260,000 | |
| Previous Owner | Friggens Brian Joseph | $301,342 | |
| Previous Owner | Kopp Noma J | $231,200 |
Source: Public Records
Tax History Compared to Growth
Tax History
| Year | Tax Paid | Tax Assessment Tax Assessment Total Assessment is a certain percentage of the fair market value that is determined by local assessors to be the total taxable value of land and additions on the property. | Land | Improvement |
|---|---|---|---|---|
| 2024 | $2,301 | $207,960 | $32,400 | $175,560 |
| 2023 | $2,216 | $207,960 | $32,400 | $175,560 |
| 2022 | $2,099 | $204,780 | $32,400 | $172,380 |
| 2021 | $2,083 | $202,260 | $32,340 | $169,920 |
| 2020 | $2,092 | $202,260 | $32,340 | $169,920 |
| 2019 | $2,107 | $202,260 | $32,340 | $169,920 |
| 2018 | $1,958 | $187,320 | $32,340 | $154,980 |
| 2017 | $1,949 | $185,520 | $30,540 | $154,980 |
| 2016 | $1,946 | $184,080 | $29,100 | $154,980 |
| 2015 | $1,877 | $185,640 | $29,100 | $156,540 |
| 2014 | $1,522 | $157,800 | $27,960 | $129,840 |
Source: Public Records
Map
Nearby Homes
- 207 Josephine Dr
- 210 Josephine Dr
- 109 Trevilla Ave
- 210 Piave Ln
- 118 Park Place Dr
- 116 Corkrean Way
- 101 Summits Ridge
- 374 Brookhaven Rd
- 16 Reyes Ln
- 000 Bowers Ln
- Lot 6 Ices Ferry Estates
- Lot 7 Brookdale Dr
- Lot 6 Brookdale Dr
- Lot 8 Brookdale Dr
- Lot 17 Brookdale Dr
- 3039 Earl L Core Rd
- 3392 Earl L Core Rd
- 1945 Listravia Ave
- 22 Eastgate Dr
- 104 Ida Marie Dr
- 1020 Autumn Ave
- 1024 Autumn Ave
- 1021 Autumn Ave
- 1019 Autumn Ave
- 1023 Autumn Ave
- 1026 Autumn Ave
- 1018 Autumn Ave
- 1017 Autumn Ave
- 78 Lawrence St
- 1025 Autumn Ave
- 1065 Autumn Ave
- 74 Lawrence St
- 1061 Autumn Ave
- 1028 Autumn Ave
- 1015 Autumn Ave
- 1067 Autumn Ave
- 1016 Autumn Ave
- 80 Lawrence St
- 1057 Autumn Ave
- 1027 Autumn Ave