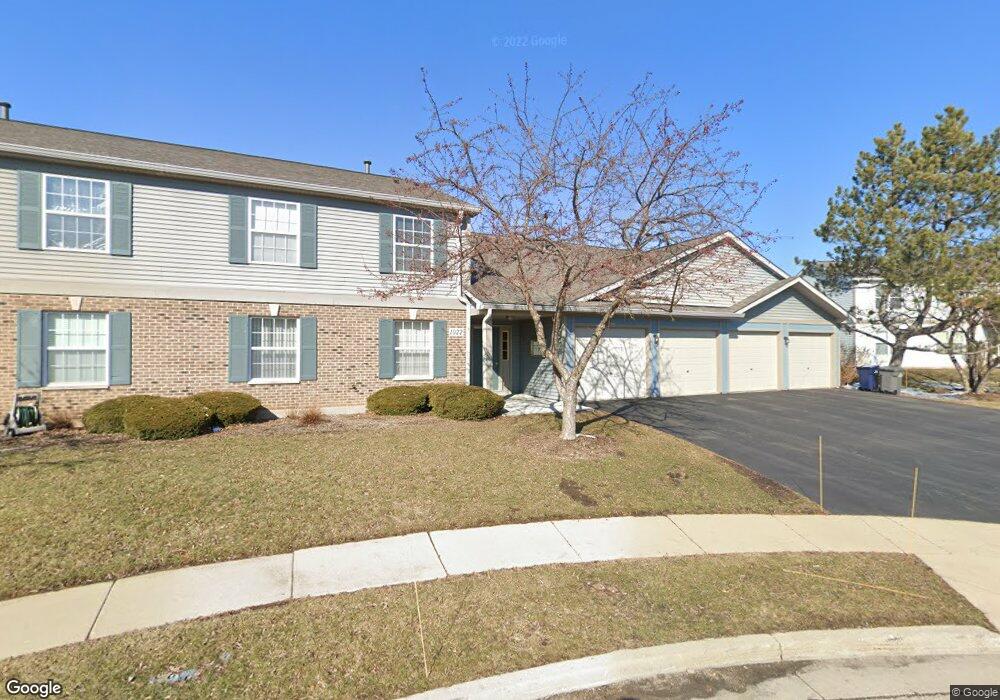
1022 Berkshire Ct Unit 36A12 Elgin, IL 60120
Bluff City NeighborhoodEstimated Value: $225,000 - $250,000
2
Beds
--
Bath
1,175
Sq Ft
$200/Sq Ft
Est. Value
About This Home
This home is located at 1022 Berkshire Ct Unit 36A12, Elgin, IL 60120 and is currently estimated at $234,438, approximately $199 per square foot. 1022 Berkshire Ct Unit 36A12 is a home located in Cook County with nearby schools including Hilltop Elementary School, Ellis Middle School, and Elgin High School.
Ownership History
Date
Name
Owned For
Owner Type
Purchase Details
Closed on
Apr 10, 2024
Sold by
Betancourt Bryan and Betancourt Daniela
Bought by
Betancourt Daniela
Current Estimated Value
Purchase Details
Closed on
Sep 17, 2019
Sold by
Sanfilippo Peter J
Bought by
Betancourt Daniela and Betancourt Bryan
Home Financials for this Owner
Home Financials are based on the most recent Mortgage that was taken out on this home.
Original Mortgage
$129,044
Interest Rate
4.25%
Mortgage Type
FHA
Purchase Details
Closed on
May 14, 2001
Sold by
Jumbeck Eugene L and Jumbeck Christine M
Bought by
Sanfilippo Peter J
Home Financials for this Owner
Home Financials are based on the most recent Mortgage that was taken out on this home.
Original Mortgage
$108,000
Interest Rate
7.07%
Mortgage Type
VA
Create a Home Valuation Report for This Property
The Home Valuation Report is an in-depth analysis detailing your home's value as well as a comparison with similar homes in the area
Home Values in the Area
Average Home Value in this Area
Purchase History
| Date | Buyer | Sale Price | Title Company |
|---|---|---|---|
| Betancourt Daniela | -- | None Listed On Document | |
| Betancourt Daniela | $133,500 | Affinity Title Services Llc | |
| Sanfilippo Peter J | $108,000 | -- |
Source: Public Records
Mortgage History
| Date | Status | Borrower | Loan Amount |
|---|---|---|---|
| Previous Owner | Betancourt Daniela | $129,044 | |
| Previous Owner | Sanfilippo Peter J | $108,000 |
Source: Public Records
Tax History Compared to Growth
Tax History
| Year | Tax Paid | Tax Assessment Tax Assessment Total Assessment is a certain percentage of the fair market value that is determined by local assessors to be the total taxable value of land and additions on the property. | Land | Improvement |
|---|---|---|---|---|
| 2024 | $2,524 | $14,738 | $2,121 | $12,617 |
| 2023 | $2,400 | $14,738 | $2,121 | $12,617 |
| 2022 | $2,400 | $14,738 | $2,121 | $12,617 |
| 2021 | $1,412 | $10,093 | $1,713 | $8,380 |
| 2020 | $1,544 | $10,093 | $1,713 | $8,380 |
| 2019 | $153 | $11,335 | $1,713 | $9,622 |
| 2018 | $169 | $8,122 | $1,468 | $6,654 |
| 2017 | $166 | $8,122 | $1,468 | $6,654 |
| 2016 | $847 | $8,122 | $1,468 | $6,654 |
| 2015 | $981 | $7,307 | $1,305 | $6,002 |
| 2014 | $930 | $7,307 | $1,305 | $6,002 |
| 2013 | $303 | $7,307 | $1,305 | $6,002 |
Source: Public Records
Map
Nearby Homes
- 1023 Berkshire Ct Unit C
- 1107 Yorkshire Ct Unit B
- 310 Buckingham Cir Unit B
- 445 Lucile Ave
- 520 Aller Ave
- 1292 Inverness Dr
- 1002 Bruce Dr
- 536 Aller Ave
- 1087 Houston Ave
- 700 Mariner Dr
- 1256 Concord Dr
- 1366 Inverness Dr
- 149 Highbury Dr
- 130 Stonehurst Dr
- 1320 Aspen Ct
- 821 Bode Rd Unit 15
- 821 Bode Rd Unit 12
- 764 Terrace Ct Unit A
- 26 Glen Echo Rd
- 645 Lavoie Ave
- 1022 Berkshire Ct Unit 36A22
- 1022 Berkshire Ct Unit 36B12
- 1022 Berkshire Ct Unit 36B22
- 1022 Berkshire Ct Unit D
- 1022 Berkshire Ct Unit B
- 1022 Berkshire Ct Unit A
- 1020 Berkshire Ct Unit D
- 1020 Berkshire Ct Unit 36A1-1
- 1020 Berkshire Ct Unit 36A11
- 1020 Berkshire Ct Unit 36B21
- 1020 Berkshire Ct Unit 36B11
- 1020 Berkshire Ct Unit 36A21
- 1020 Berkshire Ct Unit B
- 1020 Berkshire Ct Unit C
- 1020 Berkshire Ct Unit A
- 1020 Berkshire Ct
- 1029 Wynnfield Ct Unit 15B12
- 1029 Wynnfield Ct Unit 15B22
- 1029 Wynnfield Ct Unit 15A22
- 1029 Wynnfield Ct Unit 15A12