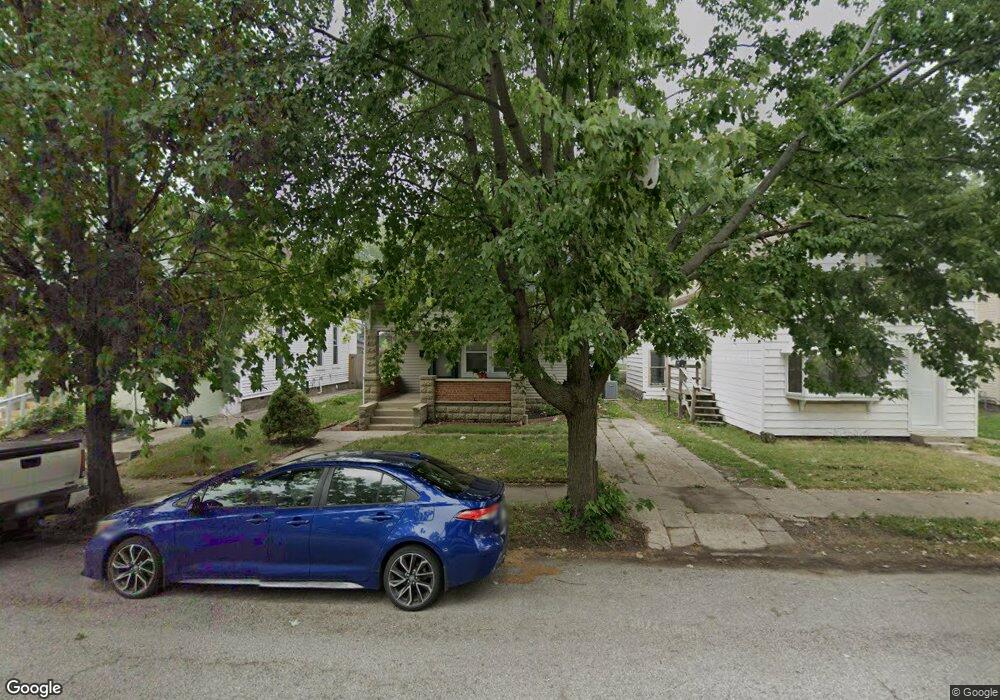
1022 Hartford St Lafayette, IN 47904
Lincoln NeighborhoodEstimated Value: $95,385 - $221,000
--
Bed
--
Bath
1,950
Sq Ft
$71/Sq Ft
Est. Value
About This Home
This home is located at 1022 Hartford St, Lafayette, IN 47904 and is currently estimated at $138,795, approximately $71 per square foot. 1022 Hartford St is a home with nearby schools including Thomas Miller Elementary School, Sunnyside Intermediate School, and Lafayette Tecumseh Junior High School.
Ownership History
Date
Name
Owned For
Owner Type
Purchase Details
Closed on
Apr 5, 2021
Sold by
Sutter Linda M
Bought by
Aliaga Daniel G and Barreto Ligia V
Current Estimated Value
Purchase Details
Closed on
Jan 22, 2019
Sold by
Tippecanoe County Sheriff
Bought by
Sutter Linda M
Purchase Details
Closed on
Jan 11, 2007
Sold by
Collins Bill G and Phillips Linda
Bought by
Wells Fargo Bank Na and First Franklin Mortgage Loan Trust 2004-
Purchase Details
Closed on
Apr 4, 2003
Sold by
Collins William and Collins Margaret
Bought by
Collins Bill G and Collins Margaret
Purchase Details
Closed on
Jun 18, 2002
Sold by
Workman Ruby Ellen
Bought by
Collins William and Collins Margaret
Home Financials for this Owner
Home Financials are based on the most recent Mortgage that was taken out on this home.
Original Mortgage
$65,000
Interest Rate
6.82%
Mortgage Type
Commercial
Create a Home Valuation Report for This Property
The Home Valuation Report is an in-depth analysis detailing your home's value as well as a comparison with similar homes in the area
Home Values in the Area
Average Home Value in this Area
Purchase History
| Date | Buyer | Sale Price | Title Company |
|---|---|---|---|
| Aliaga Daniel G | -- | First American Title | |
| Aliaga Daniel G | -- | None Available | |
| Sutter Linda M | $26,000 | None Available | |
| Wells Fargo Bank Na | $55,250 | None Available | |
| Collins Bill G | -- | -- | |
| Collins William | -- | -- |
Source: Public Records
Mortgage History
| Date | Status | Borrower | Loan Amount |
|---|---|---|---|
| Previous Owner | Collins William | $65,000 |
Source: Public Records
Tax History Compared to Growth
Tax History
| Year | Tax Paid | Tax Assessment Tax Assessment Total Assessment is a certain percentage of the fair market value that is determined by local assessors to be the total taxable value of land and additions on the property. | Land | Improvement |
|---|---|---|---|---|
| 2024 | $2,556 | $82,100 | $13,000 | $69,100 |
| 2023 | $1,792 | $89,600 | $13,000 | $76,600 |
| 2022 | $1,748 | $87,400 | $13,000 | $74,400 |
| 2021 | $1,714 | $85,700 | $13,000 | $72,700 |
| 2020 | $1,428 | $71,400 | $13,000 | $58,400 |
| 2019 | $1,428 | $71,400 | $11,000 | $60,400 |
| 2018 | $1,428 | $71,400 | $11,000 | $60,400 |
| 2017 | $1,390 | $69,500 | $11,000 | $58,500 |
| 2016 | $1,378 | $68,850 | $11,000 | $57,850 |
| 2014 | $1,306 | $65,300 | $11,000 | $54,300 |
| 2013 | $1,228 | $61,400 | $11,000 | $50,400 |
Source: Public Records
Map
Nearby Homes
- 1000 Hartford St
- 802 Tippecanoe St
- 1411 N 14th St
- 620 N 11th St Unit 22
- 1430 N 16th St
- 1201 Cincinnati St
- 1803 Pierce St
- 511 N 7th St
- 640 Perrin Ave
- 420 Tinkler St
- 629 North St
- 1831 N 13th St
- 1904 Greenbush St
- 1931 Morton St
- 1925 Maple St
- 802 Columbia St
- 2103 Union St
- 108 Barbee St
- 1440 South St
- 2100 N 18th St
- 1020 Hartford St
- 1026 Hartford St
- 1016 Hartford St
- 1030 Hartford St
- 1104 N 12th St
- 1012 Hartford St
- 1015 Heath St
- 1015 Heath St
- 1114 N 12th St
- 1006 Hartford St
- 1031 Hartford St
- 1023 Hartford St
- 1019 Hartford St
- 1020 N 12th St
- 1117 N 10th St
- 1120 N 12th St
- 1015 Hartford St
- 1031 Heath St
- 1013 Hartford St
- 1019 Heath St