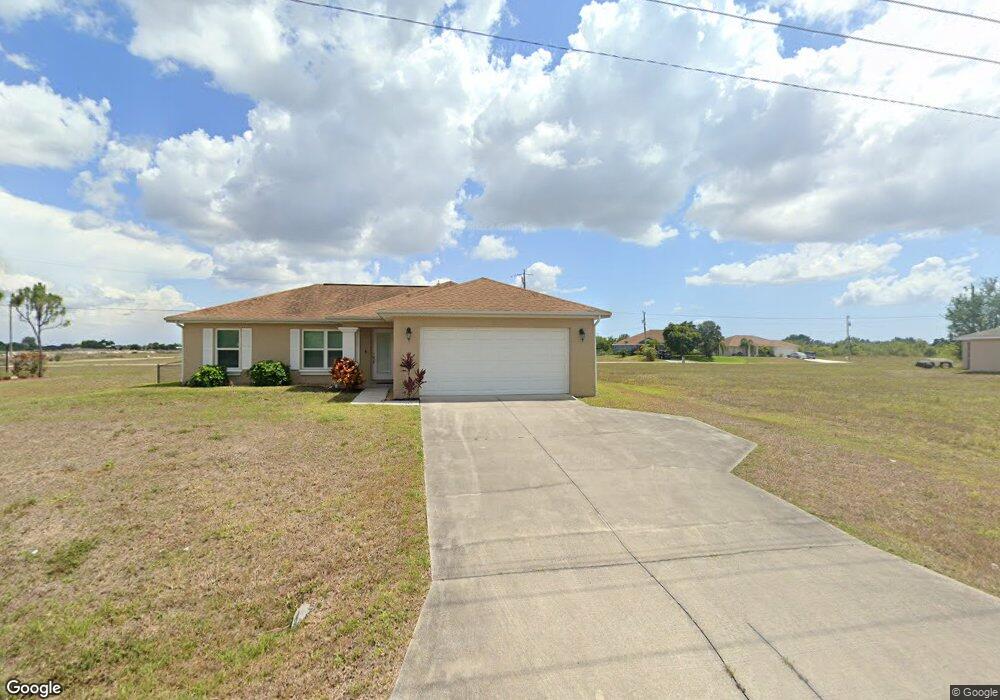
1022 Kismet Pkwy E Cape Coral, FL 33909
Diplomat NeighborhoodEstimated Value: $233,000 - $322,000
3
Beds
2
Baths
1,272
Sq Ft
$217/Sq Ft
Est. Value
About This Home
This home is located at 1022 Kismet Pkwy E, Cape Coral, FL 33909 and is currently estimated at $276,107, approximately $217 per square foot. 1022 Kismet Pkwy E is a home located in Lee County with nearby schools including Dr. Carrie D. Robinson Littleton Elementary School, Caloosa Elementary School, and Tropic Isles Elementary School.
Ownership History
Date
Name
Owned For
Owner Type
Purchase Details
Closed on
Nov 30, 2011
Sold by
Res Fl Five Llc
Bought by
Fischer William E and Fischer Susan
Current Estimated Value
Home Financials for this Owner
Home Financials are based on the most recent Mortgage that was taken out on this home.
Original Mortgage
$50,600
Outstanding Balance
$34,720
Interest Rate
4.15%
Mortgage Type
New Conventional
Estimated Equity
$241,387
Purchase Details
Closed on
Jun 7, 2011
Sold by
Lopez Litza
Bought by
Res Fl Five Llc
Purchase Details
Closed on
Mar 19, 2005
Sold by
Galindo Hector Mario and Azcona Nury
Bought by
First Home Builders Of Florida
Purchase Details
Closed on
Nov 15, 2003
Sold by
Cape Coral Lots Inc
Bought by
Azcona Nury and Galindo Hector Mario
Purchase Details
Closed on
Oct 29, 2003
Sold by
Wielgus John and Wielgus Mary A
Bought by
Cape Coral Lots Inc
Create a Home Valuation Report for This Property
The Home Valuation Report is an in-depth analysis detailing your home's value as well as a comparison with similar homes in the area
Home Values in the Area
Average Home Value in this Area
Purchase History
| Date | Buyer | Sale Price | Title Company |
|---|---|---|---|
| Fischer William E | $63,250 | Attorney | |
| Res Fl Five Llc | $52,100 | None Available | |
| First Home Builders Of Florida | $55,000 | First Home Title Inc | |
| Azcona Nury | $15,114 | -- | |
| Cape Coral Lots Inc | $11,900 | -- |
Source: Public Records
Mortgage History
| Date | Status | Borrower | Loan Amount |
|---|---|---|---|
| Open | Fischer William E | $50,600 |
Source: Public Records
Tax History Compared to Growth
Tax History
| Year | Tax Paid | Tax Assessment Tax Assessment Total Assessment is a certain percentage of the fair market value that is determined by local assessors to be the total taxable value of land and additions on the property. | Land | Improvement |
|---|---|---|---|---|
| 2025 | $7,448 | $204,041 | -- | -- |
| 2024 | $7,448 | $185,492 | -- | -- |
| 2023 | $3,907 | $168,629 | $0 | $0 |
| 2022 | $3,358 | $153,299 | $0 | $0 |
| 2021 | $2,982 | $139,363 | $10,487 | $128,876 |
| 2020 | $2,893 | $130,018 | $8,600 | $121,418 |
| 2019 | $2,738 | $125,968 | $8,500 | $117,468 |
| 2018 | $2,656 | $127,584 | $11,000 | $116,584 |
| 2017 | $2,535 | $121,926 | $7,100 | $114,826 |
| 2016 | $2,308 | $106,243 | $8,835 | $97,408 |
| 2015 | $2,127 | $92,804 | $7,996 | $84,808 |
| 2014 | $1,937 | $83,804 | $5,922 | $77,882 |
| 2013 | -- | $70,614 | $4,800 | $65,814 |
Source: Public Records
Map
Nearby Homes
- 1011 NE 23rd Terrace
- 1024 NE 23rd Terrace
- 106 NE 23rd St
- 2220 NE 9th Place
- 1408 NE 23rd Terrace
- 910 NE 23rd Terrace
- 1819 NE 23rd Terrace
- 1019 NE 23rd Terrace
- 2133 NE 23rd Terrace
- 1627 NE 23rd Terrace
- 913 NE 23rd Terrace
- 824 NE 23rd Terrace
- 2014 NE 9th Ave
- 4011 NE 9th Ave
- 4143 NE 9th Ave
- 4003 NE 9th Ave
- 1302 NE 9th Ave
- 1222 NE 9th Ave
- 1628 Kismet Pkwy E
- 2128 NE 9th Place
- 1018 Kismet Pkwy E
- 1018 Kismet Pkwy E Unit 31
- 1014 Kismet Pkwy E
- 1010 Kismet Pkwy E
- 1011 NE 23rd Terrace Unit 49
- 1020 NE 23rd Terrace
- 1016 NE 23rd Terrace
- 1012 NE 23rd Terrace
- 1101 Kismet Pkwy W
- 1008 NE 23rd Terrace
- 930 NE 23rd Terrace
- 924 Kismet Pkwy E
- 1011 NE 23rd St
- 923 Kismet Pkwy E
- 409 NE 23rd Terrace Unit 37
- 409 NE 23rd Terrace
- 914 NE 23rd Terrace Unit 44
- 1420 NE 23rd Terrace Unit 35
- 1510 NE 23rd Terrace
- 1630 NE 23rd Terrace