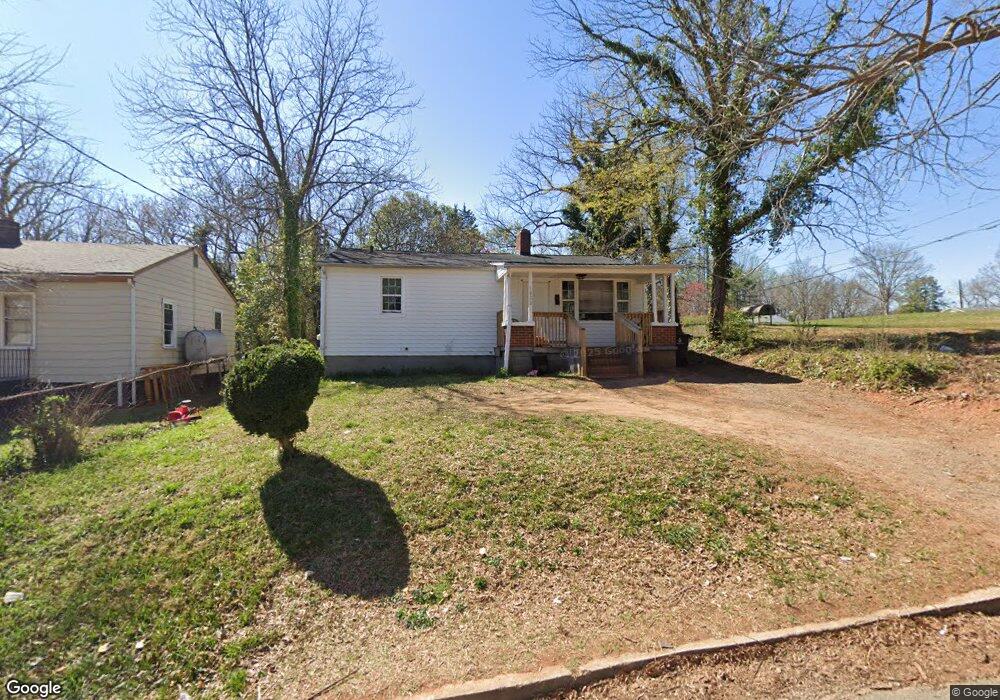
1022 Manly St Winston Salem, NC 27105
West Highlands NeighborhoodEstimated Value: $88,000 - $140,000
About This Home
As of March 2014Investment property SHORT SALE SOLD AS IS WHERE IS. - buyer to verify all systems rented $450 per month
Home Details
Home Type
- Single Family
Year Built
- Built in 1955
Lot Details
- 4,792 Sq Ft Lot
- Property is zoned RS7
Parking
- No Garage
Home Design
- Vinyl Siding
Interior Spaces
- 986 Sq Ft Home
- Property has 1 Level
Bedrooms and Bathrooms
- 3 Bedrooms
- 1 Full Bathroom
Utilities
- No Heating
- Electric Water Heater
Community Details
- No Home Owners Association
- Chatham Heights Subdivision
Listing and Financial Details
- Assessor Parcel Number 6826801318
- 1% Total Tax Rate
Ownership History
Purchase Details
Home Financials for this Owner
Home Financials are based on the most recent Mortgage that was taken out on this home.Home Values in the Area
Average Home Value in this Area
Purchase History
| Date | Buyer | Sale Price | Title Company |
|---|---|---|---|
| Salem 2018021415 Trust | $28,500 | None Available |
Mortgage History
| Date | Status | Borrower | Loan Amount |
|---|---|---|---|
| Open | Salem 2018021415 Trust | $157,000 |
Property History
| Date | Event | Price | List to Sale | Price per Sq Ft |
|---|---|---|---|---|
| 03/28/2014 03/28/14 | Sold | $11,500 | -47.7% | $12 / Sq Ft |
| 03/24/2014 03/24/14 | Pending | -- | -- | -- |
| 11/13/2013 11/13/13 | For Sale | $22,000 | -- | $22 / Sq Ft |
Tax History Compared to Growth
Tax History
| Year | Tax Paid | Tax Assessment Tax Assessment Total Assessment is a certain percentage of the fair market value that is determined by local assessors to be the total taxable value of land and additions on the property. | Land | Improvement |
|---|---|---|---|---|
| 2025 | $449 | $59,500 | $13,500 | $46,000 |
| 2024 | $428 | $32,000 | $8,000 | $24,000 |
| 2023 | $428 | $32,000 | $8,000 | $24,000 |
| 2022 | $420 | $32,000 | $8,000 | $24,000 |
| 2021 | $413 | $32,000 | $8,000 | $24,000 |
| 2020 | $272 | $19,700 | $6,000 | $13,700 |
| 2019 | $274 | $19,700 | $6,000 | $13,700 |
| 2018 | $260 | $19,700 | $6,000 | $13,700 |
| 2016 | $417 | $31,686 | $6,000 | $25,686 |
| 2015 | $411 | $31,686 | $6,000 | $25,686 |
| 2014 | $398 | $31,686 | $6,000 | $25,686 |
Map
Source: Triad MLS
MLS Number: 690090
APN: 6826-80-1318
Disclaimer: Certain information contained herein is derived from information provided by parties other than Homes.com. All information provided is deemed reliable, but is not guaranteed to be accurate and should be independently verified.
![]() Copyright 2025 Triad MLS, Inc. All rights reserved. IDX information is provided exclusively for personal, non-commercial use, and may not be used for any purpose other than to identify prospective properties consumers may be interested in purchasing. Information is deemed reliable but not guaranteed. This site will be monitored for ‘scraping’ and any use of search facilities of data on the site other than by potential buyers/sellers is prohibited. All Sale data is for informational purposes only and is not an indication of a market analysis or appraisal. Properties marked with the Triad MLS, Inc. icon are provided courtesy of the Triad MLS, Inc.’s, Internet Data Exchange Database.
Copyright 2025 Triad MLS, Inc. All rights reserved. IDX information is provided exclusively for personal, non-commercial use, and may not be used for any purpose other than to identify prospective properties consumers may be interested in purchasing. Information is deemed reliable but not guaranteed. This site will be monitored for ‘scraping’ and any use of search facilities of data on the site other than by potential buyers/sellers is prohibited. All Sale data is for informational purposes only and is not an indication of a market analysis or appraisal. Properties marked with the Triad MLS, Inc. icon are provided courtesy of the Triad MLS, Inc.’s, Internet Data Exchange Database.
- 1029 Rundell St
- 1022 Rundell St
- 1117 Rundell St
- 823 W 7th St
- 708 Manly St
- 819 W 7th St
- 195 W End Blvd
- 631 Summit St
- 157 W End Blvd
- 809 Garfield Ct
- 931 Pittsburg Ave
- 523 Summit St
- 1620 N Cherry St
- 1624 N Cherry St
- 1718 Thurmond St
- 836 Oak St NW
- 909 Roosevelt St
- 316 Wiley Ave
- 1831 Angelo St
- 1045 Wendover Cir