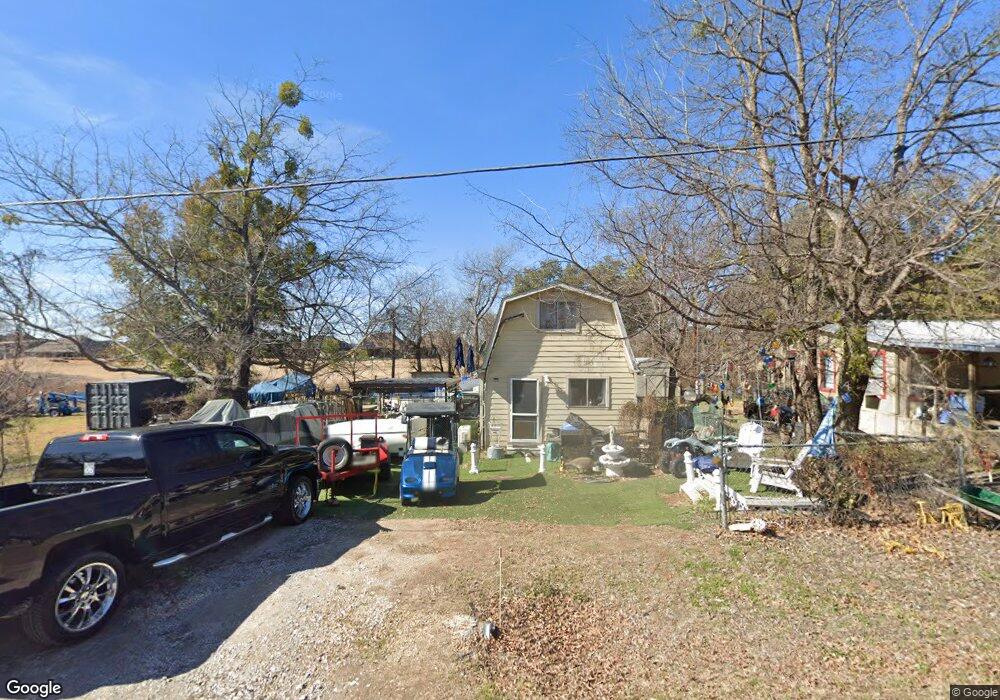
1022 Mustang Trail Granbury, TX 76049
Estimated Value: $159,441 - $201,000
2
Beds
1
Bath
904
Sq Ft
$202/Sq Ft
Est. Value
About This Home
This home is located at 1022 Mustang Trail, Granbury, TX 76049 and is currently estimated at $182,360, approximately $201 per square foot. 1022 Mustang Trail is a home located in Hood County with nearby schools including Brawner Elementary School, Acton Middle School, and Granbury High School.
Ownership History
Date
Name
Owned For
Owner Type
Purchase Details
Closed on
Feb 8, 2024
Sold by
Stefanic Michele Leann
Bought by
Stefanic Family Trust and Stefanic
Current Estimated Value
Purchase Details
Closed on
Feb 22, 2019
Sold by
Reed Michelle Melinda and Hodges Timothy
Bought by
Austin Michael
Home Financials for this Owner
Home Financials are based on the most recent Mortgage that was taken out on this home.
Original Mortgage
$43,875
Interest Rate
4.4%
Mortgage Type
Purchase Money Mortgage
Purchase Details
Closed on
Dec 8, 2010
Sold by
Reed Michelle Melinda
Bought by
Hodges Michelle Melinda
Purchase Details
Closed on
Apr 27, 2005
Sold by
Mccullough Mary A and Stumm Mary A
Bought by
Reed Michelle Melinda
Purchase Details
Closed on
Mar 29, 1994
Sold by
Koshiol Paul H
Bought by
Hodges Michelle Melinda
Purchase Details
Closed on
Jun 21, 1991
Bought by
Hodges Michelle Melinda
Create a Home Valuation Report for This Property
The Home Valuation Report is an in-depth analysis detailing your home's value as well as a comparison with similar homes in the area
Home Values in the Area
Average Home Value in this Area
Purchase History
| Date | Buyer | Sale Price | Title Company |
|---|---|---|---|
| Stefanic Family Trust | -- | None Listed On Document | |
| Austin Michael | -- | Town Square Title Company | |
| Hodges Michelle Melinda | -- | -- | |
| Reed Michelle Melinda | -- | None Available | |
| Hodges Michelle Melinda | -- | -- | |
| Hodges Michelle Melinda | -- | -- |
Source: Public Records
Mortgage History
| Date | Status | Borrower | Loan Amount |
|---|---|---|---|
| Previous Owner | Austin Michael | $43,875 |
Source: Public Records
Tax History Compared to Growth
Tax History
| Year | Tax Paid | Tax Assessment Tax Assessment Total Assessment is a certain percentage of the fair market value that is determined by local assessors to be the total taxable value of land and additions on the property. | Land | Improvement |
|---|---|---|---|---|
| 2025 | $1,076 | $89,700 | $25,000 | $64,700 |
| 2024 | $1,222 | $100,410 | $25,000 | $75,410 |
| 2023 | $1,150 | $94,490 | $25,000 | $69,490 |
| 2022 | $1,045 | $78,560 | $15,000 | $63,560 |
| 2021 | $1,019 | $66,370 | $10,000 | $56,370 |
| 2020 | $913 | $58,790 | $4,000 | $54,790 |
| 2019 | $798 | $55,880 | $4,000 | $51,880 |
| 2018 | $725 | $47,010 | $4,000 | $43,010 |
| 2017 | $678 | $42,770 | $4,000 | $38,770 |
| 2016 | $616 | $36,860 | $4,000 | $32,860 |
| 2015 | $421 | $36,950 | $4,000 | $32,950 |
| 2014 | $421 | $36,950 | $4,000 | $32,950 |
Source: Public Records
Map
Nearby Homes
- 1312 Prestwick Ct
- 1011 Hidden Cove Trail
- 1710 Broken Bow Rd
- 1714 Broken Bow Rd
- 1213 Prestwick Ct
- 1223 Prestwick Ct
- 1722 Broken Bow Rd
- 2212 Vienna Ct
- 2220 Vienna Dr
- 1712 Boot Hill Rd
- 1001 Quarry Ct
- 1838 Hidden Valley Rd
- 1102 Holiday Ct
- 2310 Vienna Dr
- 900 Pate St
- 2414 Vineyard Dr
- 2038 Clive Dr
- 2041 Clive Dr
- 1300 3rd St
- 1713 Bronco Rd
- 1020 Mustang Trail
- 1208 Hidden Cove Ct
- 1016 Mustang Trail
- 1023 Mustang Trail
- 1019 Mustang Trail
- 1025 Mustang Trail
- 1027 Mustang Trail
- 1701 Cowpoke Rd
- 1108 Spur Trail
- 1114 Spur Trail
- 1100 Spur Trail
- 1201 Hidden Cove Ct
- 1009 Mustang Trail
- 1118 Hidden Cove Trail
- 1505 Harbor Lakes Dr
- 1405 Carnoustie Ct
- 1405 Carnoustie Ct
- 1107 Spur Trail
- 1211 Hidden Cove Ct
- 1406 Carnoustie Ct