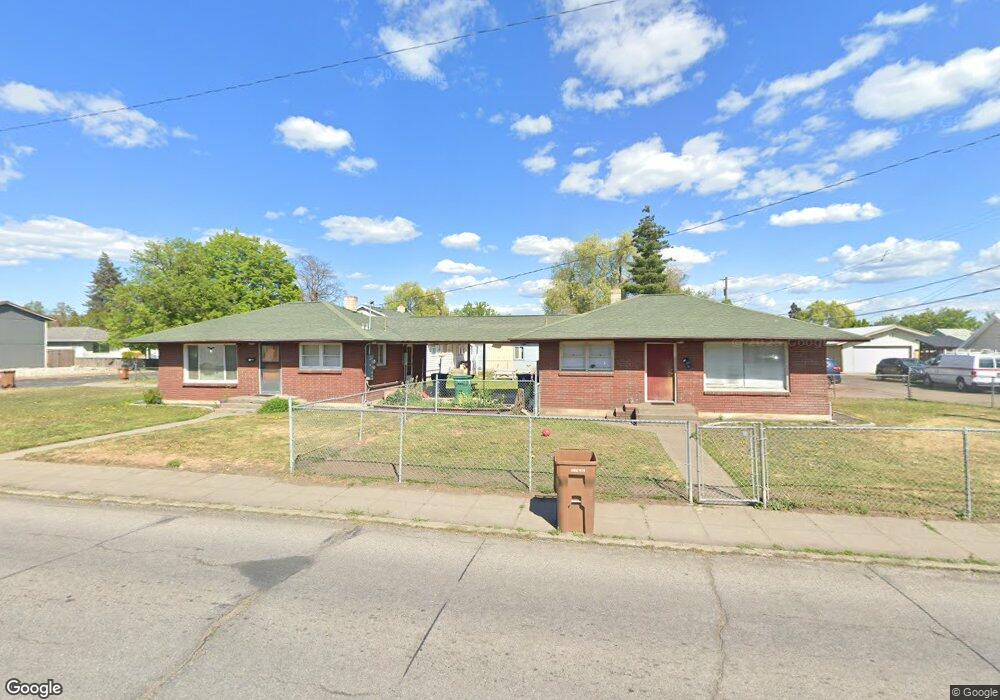
1022 N Napa St Unit 1022/1026 Spokane, WA 99202
Chief Garry Park NeighborhoodEstimated Value: $242,000 - $293,000
2
Beds
2
Baths
1,440
Sq Ft
$190/Sq Ft
Est. Value
About This Home
This home is located at 1022 N Napa St Unit 1022/1026, Spokane, WA 99202 and is currently estimated at $272,891, approximately $189 per square foot. 1022 N Napa St Unit 1022/1026 is a home located in Spokane County with nearby schools including Stevens Elementary School, Shaw Middle School, and Lewis & Clark High School.
Ownership History
Date
Name
Owned For
Owner Type
Purchase Details
Closed on
Dec 23, 2020
Sold by
Worthwhile Home Solutions Llc
Bought by
Clark Jeremy J
Current Estimated Value
Home Financials for this Owner
Home Financials are based on the most recent Mortgage that was taken out on this home.
Original Mortgage
$147,000
Outstanding Balance
$130,874
Interest Rate
2.7%
Mortgage Type
New Conventional
Estimated Equity
$142,017
Purchase Details
Closed on
Jun 19, 2020
Sold by
Santorsola James
Bought by
Worthwhile Home Solutions Llc
Home Financials for this Owner
Home Financials are based on the most recent Mortgage that was taken out on this home.
Original Mortgage
$126,715
Interest Rate
3.2%
Mortgage Type
Future Advance Clause Open End Mortgage
Create a Home Valuation Report for This Property
The Home Valuation Report is an in-depth analysis detailing your home's value as well as a comparison with similar homes in the area
Home Values in the Area
Average Home Value in this Area
Purchase History
| Date | Buyer | Sale Price | Title Company |
|---|---|---|---|
| Clark Jeremy J | $210,000 | Wfg National Title Co | |
| Worthwhile Home Solutions Llc | $133,000 | First American Title Ins Co |
Source: Public Records
Mortgage History
| Date | Status | Borrower | Loan Amount |
|---|---|---|---|
| Open | Clark Jeremy J | $147,000 | |
| Previous Owner | Worthwhile Home Solutions Llc | $126,715 |
Source: Public Records
Tax History Compared to Growth
Tax History
| Year | Tax Paid | Tax Assessment Tax Assessment Total Assessment is a certain percentage of the fair market value that is determined by local assessors to be the total taxable value of land and additions on the property. | Land | Improvement |
|---|---|---|---|---|
| 2025 | $2,855 | $277,300 | $80,000 | $197,300 |
| 2024 | $2,855 | $287,400 | $75,000 | $212,400 |
| 2023 | $2,729 | $294,500 | $75,000 | $219,500 |
| 2022 | $2,472 | $278,700 | $75,000 | $203,700 |
| 2021 | $2,157 | $181,000 | $30,400 | $150,600 |
| 2020 | $2,062 | $166,600 | $26,600 | $140,000 |
| 2019 | $1,877 | $156,830 | $16,630 | $140,200 |
| 2018 | $1,687 | $121,050 | $14,250 | $106,800 |
| 2017 | $1,522 | $111,150 | $14,250 | $96,900 |
| 2016 | $1,410 | $100,750 | $14,250 | $86,500 |
| 2015 | $1,291 | $90,200 | $15,000 | $75,200 |
| 2014 | -- | $88,100 | $15,000 | $73,100 |
| 2013 | -- | $0 | $0 | $0 |
Source: Public Records
Map
Nearby Homes
- 2002 E Boone Ave Unit s A & B
- 2002 E Boone Ave
- 1922 E Cataldo Ave
- 1212 N Magnolia St
- 2022 E Mallon Ave
- 2204 E Cataldo Ave
- 1807 E Boone Ave
- 2029 E Sharp Ave
- 1112 N Stone St
- 1506 E Cataldo Ave
- 1708 E Mallon Ave
- 1633 E Boone Ave Unit H
- 1907 E Sinto Ave
- 2417 E Desmet Ave
- 1528 E Boone Ave
- 2302 E Mission Ave
- 1509 N Lee St
- 2203 E Mission Ave
- 1708 E Tilsley Place
- 2624 E Boone Ave
- 1022 N Napa St
- 1026 N Napa St
- 2008 E Desmet Ave
- 2018 E Desmet Ave
- 1014 N Napa St
- 1025 N Napa St
- 1017 N Napa St
- 2022 E Desmet Ave
- 1011 N Napa St
- 2003 E Cataldo Ave
- 2003 E Desmet Ave
- 2009 E Desmet Ave
- 1001 N Napa St
- 1918 E Desmet Ave
- 2007 E Desmet Ave
- 1017 N Crestline St
- 1923 E Cataldo Ave
- 1927 E Desmet Ave Unit 2
- 1927 E Desmet Ave Unit 1
- 1927 E Desmet Ave