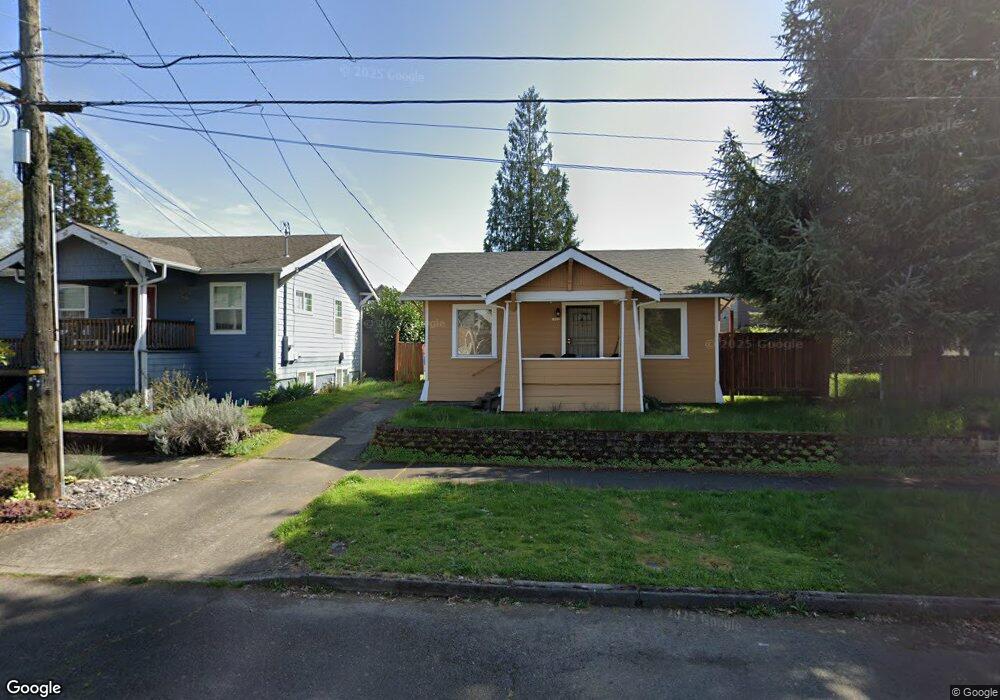
1022 N Simpson St Portland, OR 97217
Humboldt NeighborhoodEstimated Value: $479,000 - $614,000
3
Beds
2
Baths
1,070
Sq Ft
$492/Sq Ft
Est. Value
About This Home
This home is located at 1022 N Simpson St, Portland, OR 97217 and is currently estimated at $526,469, approximately $492 per square foot. 1022 N Simpson St is a home located in Multnomah County with nearby schools including Beach Elementary School, Ockley Green, and Jefferson High School.
Ownership History
Date
Name
Owned For
Owner Type
Purchase Details
Closed on
Sep 23, 2010
Sold by
The Secretary Of Veterans Affairs
Bought by
Stigler Johnny
Current Estimated Value
Home Financials for this Owner
Home Financials are based on the most recent Mortgage that was taken out on this home.
Original Mortgage
$138,139
Outstanding Balance
$90,707
Interest Rate
4.33%
Mortgage Type
FHA
Estimated Equity
$435,762
Purchase Details
Closed on
Jun 16, 2010
Sold by
Midfirst Bank
Bought by
The Secretary Of Veterans Affairs
Purchase Details
Closed on
Jun 15, 2010
Sold by
Webster Lawrence Byron
Bought by
Midfirst Bank
Purchase Details
Closed on
Jun 29, 2004
Sold by
Jones Barbara L
Bought by
Webster Lawrence Byron
Home Financials for this Owner
Home Financials are based on the most recent Mortgage that was taken out on this home.
Original Mortgage
$169,932
Interest Rate
6.27%
Mortgage Type
VA
Create a Home Valuation Report for This Property
The Home Valuation Report is an in-depth analysis detailing your home's value as well as a comparison with similar homes in the area
Home Values in the Area
Average Home Value in this Area
Purchase History
| Date | Buyer | Sale Price | Title Company |
|---|---|---|---|
| Stigler Johnny | $140,000 | Fatco | |
| The Secretary Of Veterans Affairs | -- | First American Title Ins Co | |
| Midfirst Bank | $181,338 | Fatco | |
| Webster Lawrence Byron | $165,950 | Fidelity Natl Title Co Of Or |
Source: Public Records
Mortgage History
| Date | Status | Borrower | Loan Amount |
|---|---|---|---|
| Open | Stigler Johnny | $138,139 | |
| Previous Owner | Webster Lawrence Byron | $169,932 |
Source: Public Records
Tax History Compared to Growth
Tax History
| Year | Tax Paid | Tax Assessment Tax Assessment Total Assessment is a certain percentage of the fair market value that is determined by local assessors to be the total taxable value of land and additions on the property. | Land | Improvement |
|---|---|---|---|---|
| 2025 | $3,402 | $126,240 | -- | -- |
| 2024 | $3,279 | $122,570 | -- | -- |
| 2023 | $3,153 | $119,000 | $0 | $0 |
| 2022 | $3,085 | $115,540 | $0 | $0 |
| 2021 | $3,033 | $112,180 | $0 | $0 |
| 2020 | $2,783 | $108,920 | $0 | $0 |
| 2019 | $2,680 | $105,750 | $0 | $0 |
| 2018 | $2,601 | $102,670 | $0 | $0 |
| 2017 | $2,493 | $99,680 | $0 | $0 |
| 2016 | $2,282 | $96,780 | $0 | $0 |
| 2015 | $2,222 | $93,970 | $0 | $0 |
| 2014 | $2,189 | $91,240 | $0 | $0 |
Source: Public Records
Map
Nearby Homes
- 5860 N Missouri Ave
- 5814 N Mississippi Ave
- 1366 N Simpson St Unit 4
- 6120 N Montana Ave
- 5505 N Minnesota Ave
- 5606 N Maryland Ave
- 1480 N Jarrett St Unit 103
- 6219 N Minnesota Ave
- 5406 N Missouri Ave
- 1455 N Killingsworth St Unit 316
- 1455 N Killingsworth St Unit 404
- 1455 N Killingsworth St Unit 201
- 1455 N Killingsworth St Unit 313
- 1455 N Killingsworth St Unit 415
- 708 N Killingsworth St Unit 7
- 708 N Killingsworth St Unit 3
- 708 N Killingsworth St Unit 11
- 708 N Killingsworth St Unit 8
- 708 N Killingsworth St Unit 12
- 708 N Killingsworth St Unit 5
- 5868 N Missouri Ave Unit 5
- 1016 N Simpson St
- 5866 N Missouri Ave Unit 4
- 5836 N Missouri Ave
- 5823 N Michigan Ave
- 5826 N Missouri Ave
- 5864 N Missouri Ave Unit 3
- 1023 N Jarrett St
- 1002 N Simpson St
- 5817 N Michigan Ave
- 5816 N Missouri Ave
- 5860 N Missouri Ave Unit 1
- 1015 N Jarrett St
- 1011 N Jarrett St
- 5804 N Missouri Ave
- 1007 N Jarrett St
- 5906 N Missouri Ave
- 1025 N Simpson St
- 5903 N Michigan Ave
- 1017 N Simpson St