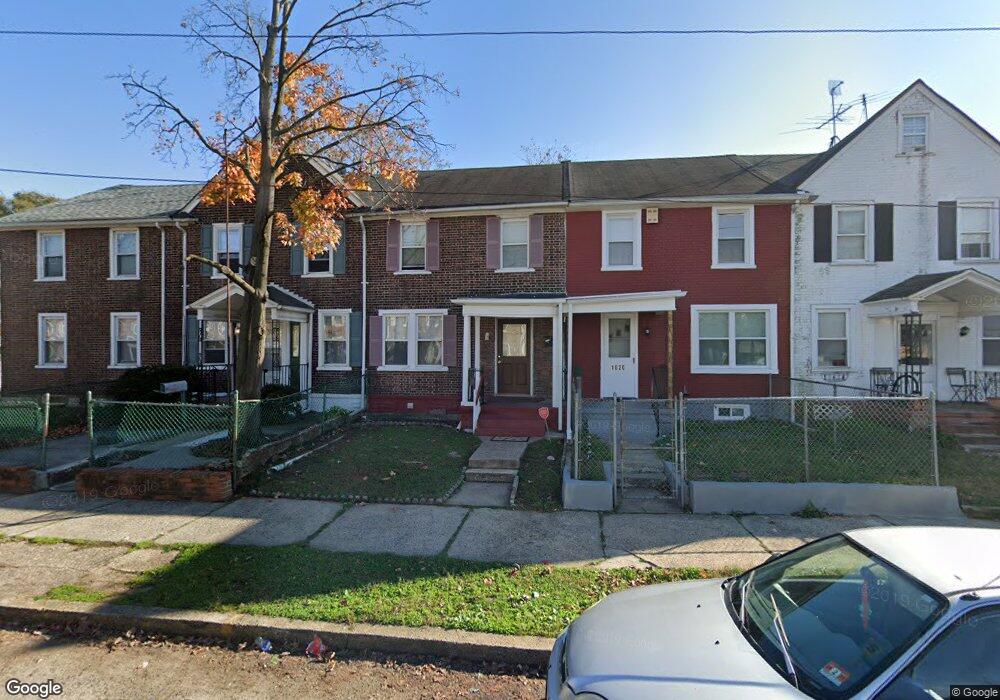
1022 Niagara Rd Camden, NJ 08104
Fairview NeighborhoodEstimated Value: $140,273 - $167,000
--
Bed
--
Bath
1,096
Sq Ft
$139/Sq Ft
Est. Value
About This Home
This home is located at 1022 Niagara Rd, Camden, NJ 08104 and is currently estimated at $152,568, approximately $139 per square foot. 1022 Niagara Rd is a home with nearby schools including Yorkship Elementary School, Camden High School, and Gloucester Catholic Junior Senior High School.
Ownership History
Date
Name
Owned For
Owner Type
Purchase Details
Closed on
Apr 26, 2021
Sold by
Real Portfolio B Llc
Bought by
Real Portfolio 10 Llc
Current Estimated Value
Purchase Details
Closed on
Oct 30, 2020
Sold by
Cjs Services Inc
Bought by
Real Portfolio 8 Llc
Purchase Details
Closed on
Jun 12, 2000
Sold by
Federal Housing Administration
Bought by
Schanne Charles J
Purchase Details
Closed on
Aug 1, 1996
Sold by
Garcia Michael J
Bought by
Williams Christine
Home Financials for this Owner
Home Financials are based on the most recent Mortgage that was taken out on this home.
Original Mortgage
$40,000
Interest Rate
8.18%
Mortgage Type
FHA
Create a Home Valuation Report for This Property
The Home Valuation Report is an in-depth analysis detailing your home's value as well as a comparison with similar homes in the area
Home Values in the Area
Average Home Value in this Area
Purchase History
| Date | Buyer | Sale Price | Title Company |
|---|---|---|---|
| Real Portfolio 10 Llc | -- | Infinity Title Agency | |
| Real Portfolio 8 Llc | $537,500 | Infinity Title Agency | |
| Schanne Charles J | $16,000 | -- | |
| Williams Christine | $39,900 | -- |
Source: Public Records
Mortgage History
| Date | Status | Borrower | Loan Amount |
|---|---|---|---|
| Previous Owner | Williams Christine | $40,000 |
Source: Public Records
Tax History Compared to Growth
Tax History
| Year | Tax Paid | Tax Assessment Tax Assessment Total Assessment is a certain percentage of the fair market value that is determined by local assessors to be the total taxable value of land and additions on the property. | Land | Improvement |
|---|---|---|---|---|
| 2025 | $1,963 | $55,400 | $14,100 | $41,300 |
| 2024 | $1,897 | $55,400 | $14,100 | $41,300 |
| 2023 | $1,897 | $55,400 | $14,100 | $41,300 |
| 2022 | $1,862 | $55,400 | $14,100 | $41,300 |
| 2021 | $1,855 | $55,400 | $14,100 | $41,300 |
| 2020 | $1,762 | $55,400 | $14,100 | $41,300 |
| 2019 | $1,687 | $55,400 | $14,100 | $41,300 |
| 2018 | $1,678 | $55,400 | $14,100 | $41,300 |
| 2017 | $1,637 | $55,400 | $14,100 | $41,300 |
| 2016 | $1,585 | $55,400 | $14,100 | $41,300 |
| 2015 | $1,526 | $55,400 | $14,100 | $41,300 |
| 2014 | $1,489 | $55,400 | $14,100 | $41,300 |
Source: Public Records
Map
Nearby Homes
- 1020 Niagara Rd
- 1029 Ironside Rd
- 1065 Ironside Rd
- 3044 Fenwick Rd
- 3159 W Ironside Rd
- 1072 S Merrimac Rd
- 2870 Kansas Rd
- 2909 Yorkship Rd
- 2845 N Constitution Rd
- 2828 Yorkship Rd Unit 1
- 1261 S Merrimac Rd
- 3069 S Chesapeake Rd
- 1333 Argus Rd
- 3079 Alabama Rd
- 2682 N Congress Rd
- 1300 S Merrimac Rd
- 1316 S Merrimac Rd
- 2931 N Constitution Rd
- 607 N Johnson Blvd
- 1433 N Chesapeake Rd
- 1024 Niagara Rd
- 1018 Niagara Rd
- 1026 Niagara Rd
- 1016 Niagara Rd
- 1031 Ironside Rd
- 1039 Ironside Rd
- 1008 Niagara Rd
- 1041 Ironside Rd
- 1027 Ironside Rd
- 1043 Ironside Rd
- 3075 Sumter Rd
- 3077 Sumter Rd
- 3056 Essex Rd
- 3079 Sumter Rd
- 1029 Niagara Rd
- 1006 Niagara Rd
- 1031 Niagara Rd
- 1025 Ironside Rd
- 1011 Niagara Rd
- 3087 Sumter Rd