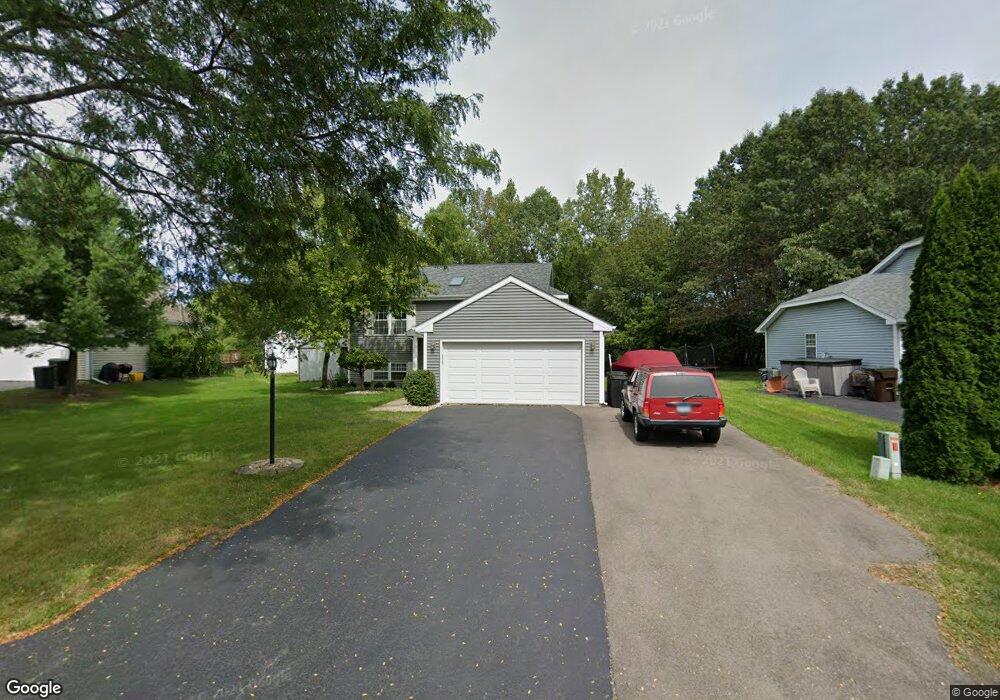
1022 Wembley Dr Unit 9 Island Lake, IL 60042
West Island Lake NeighborhoodEstimated Value: $293,000 - $338,000
3
Beds
4
Baths
859
Sq Ft
$366/Sq Ft
Est. Value
About This Home
This home is located at 1022 Wembley Dr Unit 9, Island Lake, IL 60042 and is currently estimated at $314,060, approximately $365 per square foot. 1022 Wembley Dr Unit 9 is a home located in McHenry County with nearby schools including Cotton Creek School, Matthews Middle School, and Wauconda High School.
Ownership History
Date
Name
Owned For
Owner Type
Purchase Details
Closed on
May 3, 2024
Sold by
Bartaletti Vincent B
Bought by
Schilli Amber Charmaine and Bartaletti Vincent B
Current Estimated Value
Purchase Details
Closed on
Nov 18, 2017
Sold by
Bartaletti Patricia A
Bought by
Bartaletti Vincent B
Purchase Details
Closed on
Jul 18, 2006
Sold by
Randolph James and Bartaletti Patricia
Bought by
Bartaletti Patricia A
Home Financials for this Owner
Home Financials are based on the most recent Mortgage that was taken out on this home.
Original Mortgage
$186,400
Interest Rate
6.82%
Mortgage Type
New Conventional
Purchase Details
Closed on
Sep 26, 2000
Sold by
Jacobson Thomas C and Jacobson Amy L
Bought by
Randolph James and Bartaletti Patricia A
Home Financials for this Owner
Home Financials are based on the most recent Mortgage that was taken out on this home.
Original Mortgage
$166,130
Interest Rate
7.96%
Mortgage Type
FHA
Create a Home Valuation Report for This Property
The Home Valuation Report is an in-depth analysis detailing your home's value as well as a comparison with similar homes in the area
Home Values in the Area
Average Home Value in this Area
Purchase History
| Date | Buyer | Sale Price | Title Company |
|---|---|---|---|
| Schilli Amber Charmaine | -- | None Listed On Document | |
| Bartaletti Vincent B | -- | None Available | |
| Bartaletti Patricia A | -- | Multiple | |
| Randolph James | $167,500 | Lawyers Title Pick Up |
Source: Public Records
Mortgage History
| Date | Status | Borrower | Loan Amount |
|---|---|---|---|
| Previous Owner | Bartaletti Patricia A | $186,400 | |
| Previous Owner | Randolph James | $166,130 |
Source: Public Records
Tax History Compared to Growth
Tax History
| Year | Tax Paid | Tax Assessment Tax Assessment Total Assessment is a certain percentage of the fair market value that is determined by local assessors to be the total taxable value of land and additions on the property. | Land | Improvement |
|---|---|---|---|---|
| 2024 | $5,845 | $82,071 | $17,884 | $64,187 |
| 2023 | $5,586 | $73,600 | $16,038 | $57,562 |
| 2022 | $6,038 | $66,608 | $12,210 | $54,398 |
| 2021 | $5,832 | $62,449 | $11,448 | $51,001 |
| 2020 | $5,523 | $60,577 | $11,105 | $49,472 |
| 2019 | $5,446 | $57,594 | $10,558 | $47,036 |
| 2018 | $5,211 | $54,909 | $9,917 | $44,992 |
| 2017 | $5,052 | $52,605 | $9,501 | $43,104 |
| 2016 | $4,918 | $50,191 | $9,065 | $41,126 |
| 2013 | -- | $40,100 | $8,627 | $31,473 |
Source: Public Records
Map
Nearby Homes
- 833 Dartmouth Dr Unit 7
- 1040 Wimbledon Dr Unit 7
- 3625 Newport Dr
- 4024 Newport Dr
- 3525 Southport Dr
- 811 Newport Dr
- 1125 Revere Ln
- 3816 Riverside Dr
- 4125 Hale Ln Unit 10
- 0 Southport Dr
- Lot 9 Burton Trail
- 3618 Burton Trail
- 4400 Riverside Dr
- 3807 Mccabe Ave
- 1721 Il Route 176
- 4504 Vista Dr
- NEC Route 176 & Westridge Dr
- 404 Lauren Ln
- 1909 Louise St
- 1302 Autumn Ridge Ct
- 1018 Wembley Dr
- 1026 Wembley Dr
- 1014 Wembley Dr Unit 9
- 1030 Wembley Dr
- 1010 Wembley Dr
- 1025 Wembley Dr
- 1021 Wembley Dr Unit 9
- 1100 Wembley Dr
- 1029 Wembley Dr
- 1006 Wembley Dr
- 1017 Wembley Dr
- 1103 Wembley Dr Unit 9
- 1104 Wembley Dr
- 1002 Wembley Dr
- 1005 Wembley Dr
- 1107 Wembley Dr
- 1108 Wembley Dr Unit 9
- 3806 Hale Ln
- 3808 Hale Ln
- 926 Wembley Dr Unit 8