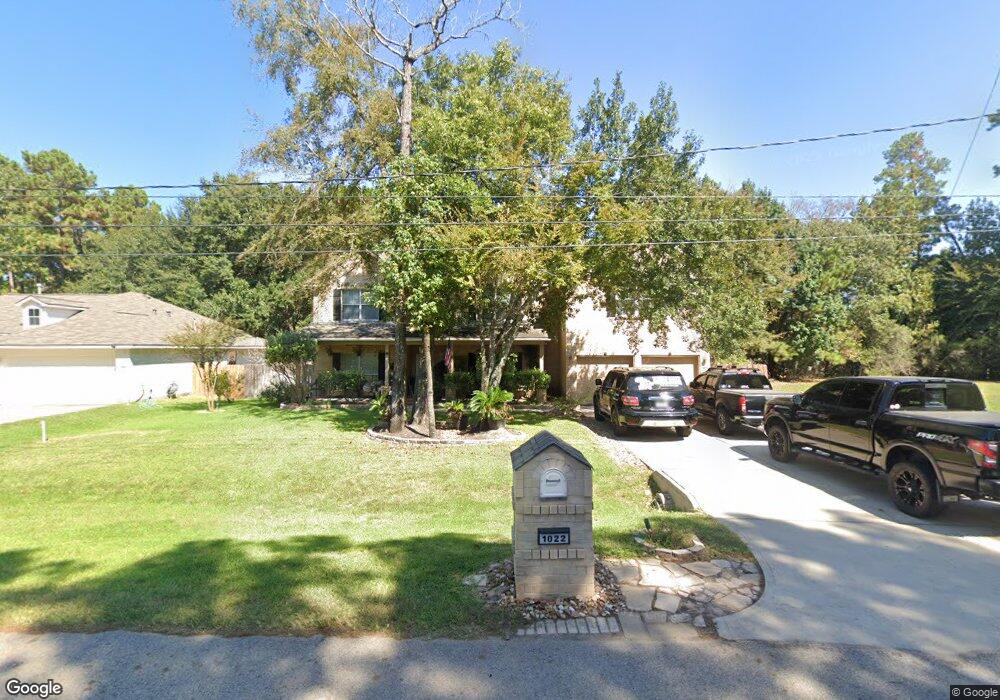
1022 Wiley Dr Magnolia, TX 77354
Estimated Value: $439,000 - $582,000
6
Beds
4
Baths
5,001
Sq Ft
$106/Sq Ft
Est. Value
About This Home
This home is located at 1022 Wiley Dr, Magnolia, TX 77354 and is currently estimated at $529,972, approximately $105 per square foot. 1022 Wiley Dr is a home located in Montgomery County with nearby schools including Tom R. Ellisor Elementary School, Bear Branch Junior High School, and Magnolia High School.
Ownership History
Date
Name
Owned For
Owner Type
Purchase Details
Closed on
Jul 28, 2008
Sold by
Royce Homes Lp
Bought by
Ramos Roman J
Current Estimated Value
Home Financials for this Owner
Home Financials are based on the most recent Mortgage that was taken out on this home.
Original Mortgage
$192,000
Outstanding Balance
$126,447
Interest Rate
6.4%
Mortgage Type
Purchase Money Mortgage
Estimated Equity
$403,525
Purchase Details
Closed on
Dec 27, 2007
Sold by
Elan Development Lp
Bought by
Royce Homes Lp
Purchase Details
Closed on
Jul 13, 2004
Sold by
Stoecker Corporation
Bought by
Ramos Roman J
Purchase Details
Closed on
Oct 28, 2003
Sold by
Ng Siu Hoi Jennifer
Bought by
Stoecker Corp
Create a Home Valuation Report for This Property
The Home Valuation Report is an in-depth analysis detailing your home's value as well as a comparison with similar homes in the area
Home Values in the Area
Average Home Value in this Area
Purchase History
| Date | Buyer | Sale Price | Title Company |
|---|---|---|---|
| Ramos Roman J | -- | Stewart Title Co | |
| Royce Homes Lp | -- | Stewart Title Company | |
| Ramos Roman J | -- | -- | |
| Stoecker Corp | -- | First Surety Title Company |
Source: Public Records
Mortgage History
| Date | Status | Borrower | Loan Amount |
|---|---|---|---|
| Open | Ramos Roman J | $192,000 | |
| Closed | Stoecker Corp | $0 |
Source: Public Records
Tax History Compared to Growth
Tax History
| Year | Tax Paid | Tax Assessment Tax Assessment Total Assessment is a certain percentage of the fair market value that is determined by local assessors to be the total taxable value of land and additions on the property. | Land | Improvement |
|---|---|---|---|---|
| 2025 | $7,125 | $560,683 | $58,000 | $502,683 |
| 2024 | $6,373 | $543,048 | -- | -- |
| 2023 | $6,373 | $493,680 | $58,000 | $543,710 |
| 2022 | $7,920 | $448,800 | $45,900 | $439,100 |
| 2021 | $7,937 | $427,040 | $42,500 | $384,540 |
| 2020 | $8,870 | $438,310 | $42,750 | $395,560 |
| 2019 | $7,777 | $386,170 | $42,750 | $343,420 |
| 2018 | $6,963 | $364,080 | $12,380 | $356,630 |
| 2017 | $7,018 | $330,980 | $12,380 | $356,630 |
| 2016 | $6,380 | $300,890 | $12,380 | $327,620 |
| 2015 | $5,120 | $273,540 | $13,380 | $265,920 |
| 2014 | $5,120 | $248,670 | $12,380 | $244,940 |
Source: Public Records
Map
Nearby Homes
- 906 Wiley Dr
- 6422 Sugar Bush Dr
- 6626 Grant Dr
- 1411 Honea Egypt Rd
- 906 Weeping Willow Way
- 1518 Honea Egypt Rd
- 6706 Durango Creek Dr
- 6718 Durango Creek Dr
- 723 Hinsdale
- 6221 Ranch Lake Dr
- 6910 Woodland Oaks
- 6846 Durango Creek Dr
- 7002 Durango Creek Dr
- 6906 Grant Dr
- 6818 Woodland Oaks
- 803 Box Elder Dr
- 6902 Woodland Oaks
- 6107 Cypress Way Dr
- 503 Weisinger Dr
- 914 Box Elder Dr
- 1102 Wiley Dr
- 1106 Wiley Dr
- 0 Grant Dr Unit 13157271
- 1014 Wiley Dr
- 6502 Grant Dr
- 1110 Wiley Dr
- 6510 Grant Dr
- 1010 Wiley Dr
- 1119 Wiley Dr
- 1011 Honea Egypt Rd
- 6514 Grant Dr
- 1114 Wiley Dr
- 1006 Wiley Dr
- 6503 Grant Dr
- 1123 Wiley Dr
- 6507 Grant Dr
- Lot 17 Honea Egypt
- 6518 Grant Dr
- 6511 Grant Dr
- 1002 Wiley Dr