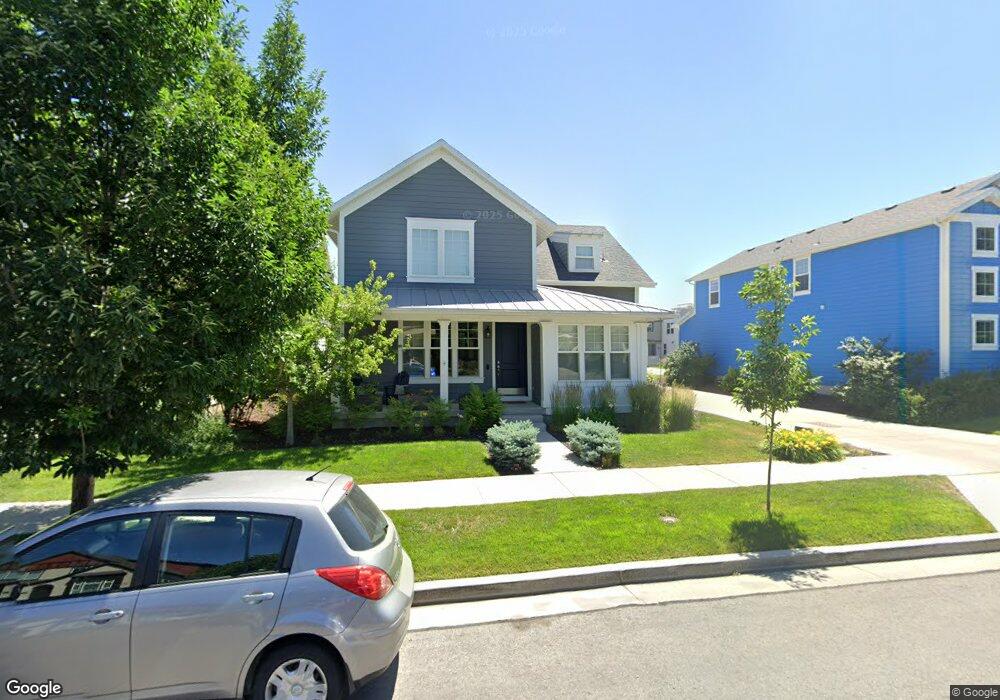
10223 S Silver Mine Rd Unit 9-609 South Jordan, UT 84009
Daybreak NeighborhoodEstimated Value: $648,000 - $703,995
3
Beds
2
Baths
3,200
Sq Ft
$210/Sq Ft
Est. Value
About This Home
This home is located at 10223 S Silver Mine Rd Unit 9-609, South Jordan, UT 84009 and is currently estimated at $670,499, approximately $209 per square foot. 10223 S Silver Mine Rd Unit 9-609 is a home located in Salt Lake County with nearby schools including Golden Fields Elementary School, Mountain Creek Middle School, and Herriman High School.
Ownership History
Date
Name
Owned For
Owner Type
Purchase Details
Closed on
Sep 6, 2018
Sold by
Barbam David and Barbam Elizabeth
Bought by
Gephart Marc
Current Estimated Value
Home Financials for this Owner
Home Financials are based on the most recent Mortgage that was taken out on this home.
Original Mortgage
$310,000
Outstanding Balance
$269,781
Interest Rate
4.5%
Mortgage Type
New Conventional
Estimated Equity
$400,718
Purchase Details
Closed on
Nov 15, 2013
Sold by
Dbsf Llc
Bought by
Barham David and Barham Elizabeth
Home Financials for this Owner
Home Financials are based on the most recent Mortgage that was taken out on this home.
Original Mortgage
$238,829
Interest Rate
4.17%
Mortgage Type
New Conventional
Create a Home Valuation Report for This Property
The Home Valuation Report is an in-depth analysis detailing your home's value as well as a comparison with similar homes in the area
Home Values in the Area
Average Home Value in this Area
Purchase History
| Date | Buyer | Sale Price | Title Company |
|---|---|---|---|
| Gephart Marc | -- | Old Republic Title | |
| Barham David | -- | Meridian Title | |
| Dbsf Llc | -- | Meridian Title |
Source: Public Records
Mortgage History
| Date | Status | Borrower | Loan Amount |
|---|---|---|---|
| Open | Gephart Marc | $310,000 | |
| Previous Owner | Barham David | $238,829 |
Source: Public Records
Tax History Compared to Growth
Tax History
| Year | Tax Paid | Tax Assessment Tax Assessment Total Assessment is a certain percentage of the fair market value that is determined by local assessors to be the total taxable value of land and additions on the property. | Land | Improvement |
|---|---|---|---|---|
| 2025 | $3,290 | $669,900 | $79,300 | $590,600 |
| 2024 | $3,290 | $624,600 | $77,000 | $547,600 |
| 2023 | $3,290 | $611,400 | $74,800 | $536,600 |
| 2022 | $3,528 | $619,400 | $73,300 | $546,100 |
| 2021 | $2,814 | $453,400 | $56,500 | $396,900 |
| 2020 | $2,724 | $411,300 | $53,200 | $358,100 |
| 2019 | $2,720 | $403,700 | $53,200 | $350,500 |
| 2018 | $0 | $349,800 | $52,700 | $297,100 |
| 2017 | $2,265 | $327,900 | $52,700 | $275,200 |
| 2016 | $2,403 | $329,600 | $52,700 | $276,900 |
| 2015 | $2,148 | $286,500 | $63,800 | $222,700 |
| 2014 | $2,144 | $281,000 | $82,200 | $198,800 |
Source: Public Records
Map
Nearby Homes
- 4722 W Vermillion Dr
- 4722 W Noyo Ln
- 10117 S Glenmoor Dr
- 4712 W South Jordan Pkwy
- 4801 W South Jordan Pkwy
- 4881 S Jordan Pkwy W
- 10027 Birdie Way
- 5023 S Jordan Pkwy W
- 4821 W Dock St
- 4523 W South Jordan Pkwy
- 10566 S Lake Ave
- 10421 S Split Rock Dr
- 4554 Birdie Way
- 10566 S Oquirrh Lake Rd
- 4438 W South Jordan Pkwy
- 10617 S Split Rock Dr
- 4966 W Kitsap Way Unit 10-532
- 4518 W Cave Run Ln
- 10426 S Millerton Dr
- 5239 W Bowstring Way Unit 518
- 10223 S Silver Mine Rd
- 10217 S Silver Mine Rd Unit 9-610
- 10217 S Silver Mine Rd
- 10233 S Silver Mine Rd Unit 9-604
- 10233 S Silver Mine Rd
- 10209 S Silver Mine Rd
- 10239 S Silver Mine Rd Unit 9-603
- 10218 S Petaluma Way
- 10226 S Petaluma Way
- 10214 S Petaluma Way
- 10222 S Silver Mine Rd
- 10232 S Petaluma Way
- 10208 S Petaluma Way
- 10243 S Silver Mine Rd
- 10224 S Silver Mine Rd W Unit 9-621
- 10238 S Petaluma Way
- 10234 S Silver Mine Rd Unit 9-622
- 10234 S Silver Mine Rd
- 10216 S Silver Mine Rd
- 10238 S Silver Mine Rd