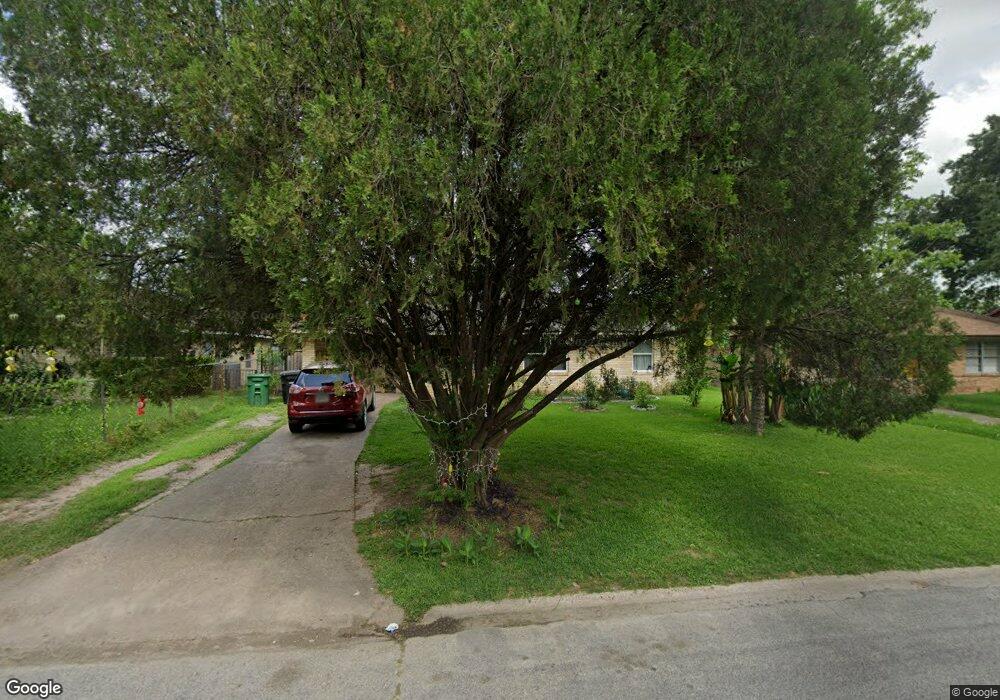
10226 Bretton Dr Houston, TX 77016
East Little York NeighborhoodEstimated Value: $117,000 - $160,000
3
Beds
1
Bath
988
Sq Ft
$142/Sq Ft
Est. Value
About This Home
This home is located at 10226 Bretton Dr, Houston, TX 77016 and is currently estimated at $140,775, approximately $142 per square foot. 10226 Bretton Dr is a home located in Harris County with nearby schools including Shadydale Elementary School, Forest Brook Middle, and North Forest High School.
Ownership History
Date
Name
Owned For
Owner Type
Purchase Details
Closed on
Sep 1, 2016
Sold by
W13 Homes Llc
Bought by
Lopez Elmer G and Depaz Yanbira M
Current Estimated Value
Home Financials for this Owner
Home Financials are based on the most recent Mortgage that was taken out on this home.
Original Mortgage
$83,000
Outstanding Balance
$66,361
Interest Rate
3.46%
Mortgage Type
Purchase Money Mortgage
Estimated Equity
$74,414
Purchase Details
Closed on
Feb 12, 2016
Sold by
Taylor Rubynell Owens and Jpmorgan Chase Bank Na
Bought by
W13 Homes Llc
Purchase Details
Closed on
Sep 11, 1996
Sold by
Walters Hollis Leon and Walters Helen Louise
Bought by
Taylor Rubynell Owens
Home Financials for this Owner
Home Financials are based on the most recent Mortgage that was taken out on this home.
Original Mortgage
$7,000
Interest Rate
7.9%
Mortgage Type
Seller Take Back
Create a Home Valuation Report for This Property
The Home Valuation Report is an in-depth analysis detailing your home's value as well as a comparison with similar homes in the area
Home Values in the Area
Average Home Value in this Area
Purchase History
| Date | Buyer | Sale Price | Title Company |
|---|---|---|---|
| Lopez Elmer G | -- | None Available | |
| W13 Homes Llc | $39,000 | None Available | |
| Taylor Rubynell Owens | -- | -- |
Source: Public Records
Mortgage History
| Date | Status | Borrower | Loan Amount |
|---|---|---|---|
| Open | Lopez Elmer G | $83,000 | |
| Previous Owner | Taylor Rubynell Owens | $7,000 |
Source: Public Records
Tax History Compared to Growth
Tax History
| Year | Tax Paid | Tax Assessment Tax Assessment Total Assessment is a certain percentage of the fair market value that is determined by local assessors to be the total taxable value of land and additions on the property. | Land | Improvement |
|---|---|---|---|---|
| 2025 | $1,932 | $109,000 | $54,915 | $54,085 |
| 2024 | $1,932 | $92,313 | $38,764 | $53,549 |
| 2023 | $1,932 | $123,107 | $38,764 | $84,343 |
| 2022 | $2,580 | $117,156 | $38,764 | $78,392 |
| 2021 | $2,159 | $92,650 | $25,842 | $66,808 |
| 2020 | $1,875 | $77,408 | $17,444 | $59,964 |
| 2019 | $1,647 | $65,094 | $11,048 | $54,046 |
| 2018 | $987 | $39,000 | $11,048 | $27,952 |
| 2017 | $986 | $52,778 | $11,048 | $41,730 |
| 2016 | $1,279 | $50,583 | $11,048 | $39,535 |
| 2015 | $1,050 | $47,481 | $11,048 | $36,433 |
| 2014 | $1,050 | $40,848 | $11,048 | $29,800 |
Source: Public Records
Map
Nearby Homes
- 10221 Bretton Dr
- 6001 Bretshire Dr
- 10122 Rockaway Dr
- 10201 Homestead Rd
- 10806 Bird of Paradise Ln
- 10808 Bird of Paradise Ln
- 10810 Bird of Paradise Ln
- 10434 Envoy St
- 10128 Homestead Rd
- 10124 Homestead Rd
- 10120 Homestead Rd
- 10430 Royal Oaks Dr
- 10317 Kelburn Dr
- 7210 Colton St
- 10526 Hollyglen Dr
- 10535 Hollyglen Dr
- 7226 Gore Dr
- 7234 Boggess Rd
- 10538 Royal Oaks Dr
- 7220 Parker Rd
- 10222 Bretton Dr
- 10230 Bretton Dr
- 10225 Hollyglen Dr
- 10218 Bretton Dr
- 10221 Hollyglen Dr
- 10229 Hollyglen Dr
- 10217 Hollyglen Dr
- 10225 Bretton Dr
- 10229 Bretton Dr
- 10214 Bretton Dr
- 10302 Bretton Dr
- 10217 Bretton Dr
- 10213 Hollyglen Dr
- 10303 Hollyglen Dr
- 10210 Bretton Dr
- 10213 Bretton Dr
- 10303 Bretton Dr
- 10306 Bretton Dr
- 10209 Hollyglen Dr
- 10226 Hollyglen Dr