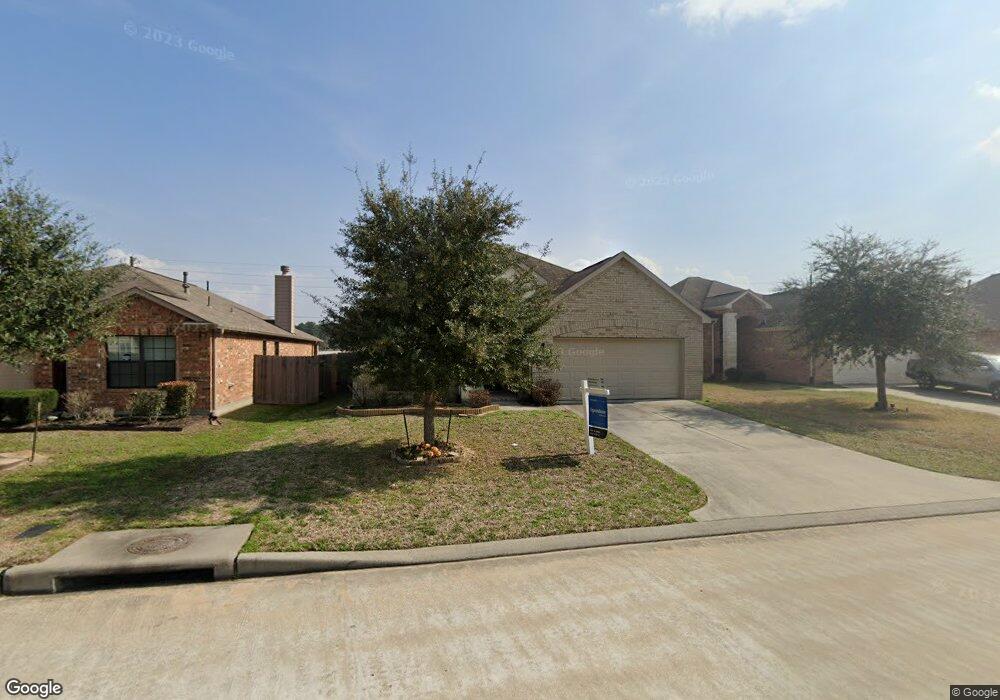
10227 Red Tamarack Ln Tomball, TX 77375
Hufsmith NeighborhoodEstimated Value: $306,000 - $320,000
3
Beds
2
Baths
2,032
Sq Ft
$154/Sq Ft
Est. Value
About This Home
This home is located at 10227 Red Tamarack Ln, Tomball, TX 77375 and is currently estimated at $312,172, approximately $153 per square foot. 10227 Red Tamarack Ln is a home located in Harris County with nearby schools including Mahaffey Elementary School, Klein Oak High School, and Comquest Academy.
Ownership History
Date
Name
Owned For
Owner Type
Purchase Details
Closed on
Mar 6, 2023
Sold by
Opendoor Property Trust
Bought by
Hickman Melinda
Current Estimated Value
Home Financials for this Owner
Home Financials are based on the most recent Mortgage that was taken out on this home.
Original Mortgage
$241,600
Outstanding Balance
$233,467
Interest Rate
6.13%
Mortgage Type
New Conventional
Estimated Equity
$78,705
Purchase Details
Closed on
Jul 11, 2022
Sold by
Graham Louise Jones
Bought by
Opendoor Property Trust
Purchase Details
Closed on
Feb 19, 2016
Sold by
Lexington 26 Lp
Bought by
Graham Louise Jones
Purchase Details
Closed on
Aug 25, 2015
Sold by
Ctmgt Pine Trace Village Fl 1 Llc
Bought by
Lexington 26 L P and Colina Homes
Home Financials for this Owner
Home Financials are based on the most recent Mortgage that was taken out on this home.
Original Mortgage
$148,750
Interest Rate
4.12%
Create a Home Valuation Report for This Property
The Home Valuation Report is an in-depth analysis detailing your home's value as well as a comparison with similar homes in the area
Home Values in the Area
Average Home Value in this Area
Purchase History
| Date | Buyer | Sale Price | Title Company |
|---|---|---|---|
| Hickman Melinda | -- | -- | |
| Opendoor Property Trust | -- | None Listed On Document | |
| Graham Louise Jones | -- | Landtitle Texas Llc | |
| Lexington 26 L P | -- | Landtitle Texas Llc |
Source: Public Records
Mortgage History
| Date | Status | Borrower | Loan Amount |
|---|---|---|---|
| Open | Hickman Melinda | $241,600 | |
| Previous Owner | Lexington 26 L P | $148,750 |
Source: Public Records
Tax History Compared to Growth
Tax History
| Year | Tax Paid | Tax Assessment Tax Assessment Total Assessment is a certain percentage of the fair market value that is determined by local assessors to be the total taxable value of land and additions on the property. | Land | Improvement |
|---|---|---|---|---|
| 2025 | $2,438 | $313,294 | $48,863 | $264,431 |
| 2024 | $2,438 | $307,725 | $52,200 | $255,525 |
| 2023 | $2,438 | $326,590 | $52,200 | $274,390 |
| 2022 | $7,862 | $290,006 | $52,200 | $237,806 |
| 2021 | $7,664 | $233,148 | $30,451 | $202,697 |
| 2020 | $7,984 | $218,920 | $30,451 | $188,469 |
| 2019 | $8,044 | $214,614 | $30,451 | $184,163 |
| 2018 | $2,274 | $207,352 | $26,971 | $180,381 |
| 2017 | $7,786 | $207,352 | $26,971 | $180,381 |
| 2016 | $7,316 | $199,905 | $26,971 | $172,934 |
| 2015 | -- | $0 | $0 | $0 |
Source: Public Records
Map
Nearby Homes
- 23003 Black Mountain Ash Ct
- 10423 Rochester Hills Ln
- 22911 Banff Brook Way
- 22906 Dale River Rd
- 10015 Easterwood Trail
- 22911 Eselle Creek Dr
- 23618 Plantation Pines Ln
- 23623 Plantation Pines Ln
- 23635 Plantation Pines Ln
- 9923 Berlandier Ash Ln
- 23730 Hiddenbriar Loop
- 23719 Plantation Pines Ln
- 0 Hufsmith Kohrville Rd Unit 13972653
- 0 Johnson Rd Rd Unit 62402995
- 9226 Stratford Place
- 8718 Kerr Dr -Lot 023
- 000 Na
- 13306 Valley Orchard Ln
- 13310 Valley Orchard Ln
- 0 Carrell St Unit 71277159
- 10227 Red Tamarack Ln
- 10223 Red Tamarack Ln
- 10231 Red Tamarack Ln
- 10219 Red Tamarack Ln
- 10235 Red Tamarack Ln
- 23006 Silver Linden Ct
- 10215 Red Tamarack Ln
- 23003 Silver Linden Ct
- 23010 Silver Linden Ct
- 10211 Red Tamarack Ln
- 23007 Black Mountain Ash Ct
- 23011 Silver Linden Ct
- 23014 Silver Linden Ct
- 10207 Red Tamarack Ln
- 23011 Black Mountain Ash Ct
- 23015 Silver Linden Ct
- 22951 Banff Brook Way
- 23018 Silver Linden Ct
- 10203 Red Tamarack Ln
- 23002 Black Mountain Ash Ct