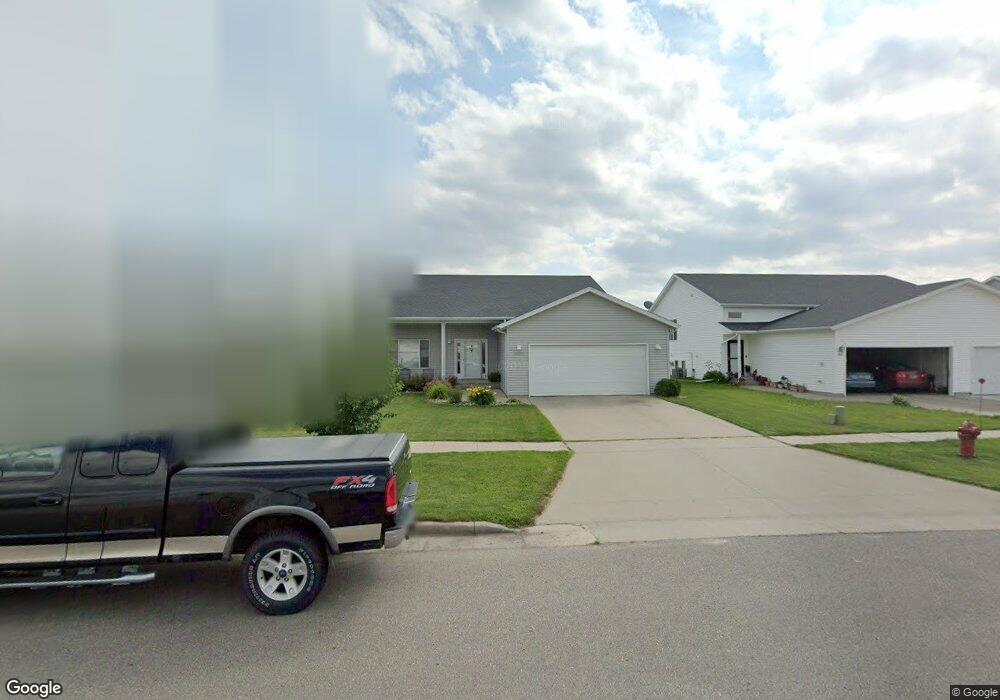
1023 38 1/2 Ave W West Fargo, ND 58078
Eagle Run NeighborhoodEstimated Value: $303,000 - $338,000
4
Beds
2
Baths
2,276
Sq Ft
$142/Sq Ft
Est. Value
About This Home
This home is located at 1023 38 1/2 Ave W, West Fargo, ND 58078 and is currently estimated at $323,529, approximately $142 per square foot. 1023 38 1/2 Ave W is a home located in Cass County with nearby schools including Aurora Elementary School, Liberty Middle School, and West Fargo Sheyenne High School.
Ownership History
Date
Name
Owned For
Owner Type
Purchase Details
Closed on
Jun 8, 2023
Sold by
Axtman Cody D
Bought by
Evenson Gunner M and Evenson Chryxaunna
Current Estimated Value
Home Financials for this Owner
Home Financials are based on the most recent Mortgage that was taken out on this home.
Original Mortgage
$289,750
Outstanding Balance
$282,059
Interest Rate
6.43%
Mortgage Type
New Conventional
Estimated Equity
$41,471
Purchase Details
Closed on
Jun 15, 2020
Sold by
Wigglesworth Brett and Wigglesworth Jessica
Bought by
Axtman Cody D
Home Financials for this Owner
Home Financials are based on the most recent Mortgage that was taken out on this home.
Original Mortgage
$211,500
Interest Rate
3.2%
Mortgage Type
New Conventional
Purchase Details
Closed on
Aug 1, 2013
Sold by
Bair Dennis A and Bair Kimberly A
Bought by
Wiggelsworth Brett and Wiggelsworth Jessica
Home Financials for this Owner
Home Financials are based on the most recent Mortgage that was taken out on this home.
Original Mortgage
$174,800
Interest Rate
4.25%
Mortgage Type
New Conventional
Create a Home Valuation Report for This Property
The Home Valuation Report is an in-depth analysis detailing your home's value as well as a comparison with similar homes in the area
Home Values in the Area
Average Home Value in this Area
Purchase History
| Date | Buyer | Sale Price | Title Company |
|---|---|---|---|
| Evenson Gunner M | $305,000 | Regency Title | |
| Axtman Cody D | $235,000 | Fm Title | |
| Wiggelsworth Brett | $184,000 | Title Co |
Source: Public Records
Mortgage History
| Date | Status | Borrower | Loan Amount |
|---|---|---|---|
| Open | Evenson Gunner M | $289,750 | |
| Previous Owner | Axtman Cody D | $211,500 | |
| Previous Owner | Wiggelsworth Brett | $174,800 |
Source: Public Records
Tax History Compared to Growth
Tax History
| Year | Tax Paid | Tax Assessment Tax Assessment Total Assessment is a certain percentage of the fair market value that is determined by local assessors to be the total taxable value of land and additions on the property. | Land | Improvement |
|---|---|---|---|---|
| 2024 | $4,028 | $153,600 | $20,800 | $132,800 |
| 2023 | $4,220 | $141,550 | $20,800 | $120,750 |
| 2022 | $3,947 | $129,950 | $20,800 | $109,150 |
| 2021 | $3,721 | $121,350 | $16,650 | $104,700 |
| 2020 | $3,474 | $114,500 | $16,650 | $97,850 |
| 2019 | $3,412 | $111,050 | $16,650 | $94,400 |
| 2018 | $3,301 | $111,000 | $16,650 | $94,350 |
| 2017 | $3,165 | $111,000 | $16,650 | $94,350 |
| 2016 | $2,733 | $108,550 | $16,650 | $91,900 |
| 2015 | $2,599 | $97,100 | $8,700 | $88,400 |
| 2014 | $2,556 | $90,750 | $8,700 | $82,050 |
| 2013 | $2,428 | $86,100 | $8,700 | $77,400 |
Source: Public Records
Map
Nearby Homes
- 1040 39th Ave W
- 909 38 1 2 Ave W
- 3662 N Sedona Ct
- 1054 42nd Ave W
- 1156 42nd Ave W Unit A
- 1236 S Beach Way
- 1168 43rd Ave W
- 1381 Westport Beach Way
- 4509 11th St W
- 4507 Newport Ln
- 4534 Westport Pkwy
- 4717 11th St W
- 4757 11th St W
- 945 31st Ave W
- 1089 Hickory Ln
- 1097 Hickory Ln
- 922 31st Ave W
- 1082 Larkin Ln
- 974 50th Ave W
- 4355 66th St S
- 1023 38 1 2 Ave W
- 1027 38 1/2 Ave W
- 1027 38 1 2 Ave W
- 1017 38 1/2 Ave W
- 1017 38 1 2 Ave W
- 1031 38 1/2 Ave W
- 1031 38 1 2 Ave W
- 1011 38 1/2 Ave W
- 1011 38 1 2 Ave W
- 1035 38 1/2 Ave W
- 1022 39 Ave W
- 1022 39th Ave W
- 1035 38 1 2 Ave W
- 1028 39th Ave W
- 1016 39th Ave W
- 1039 38 1/2 Ave W
- 1005 38 1 2 Ave W
- 1039 38 1 2 Ave W
- 1005 38 1/2 Ave W
- 1034 39th Ave W