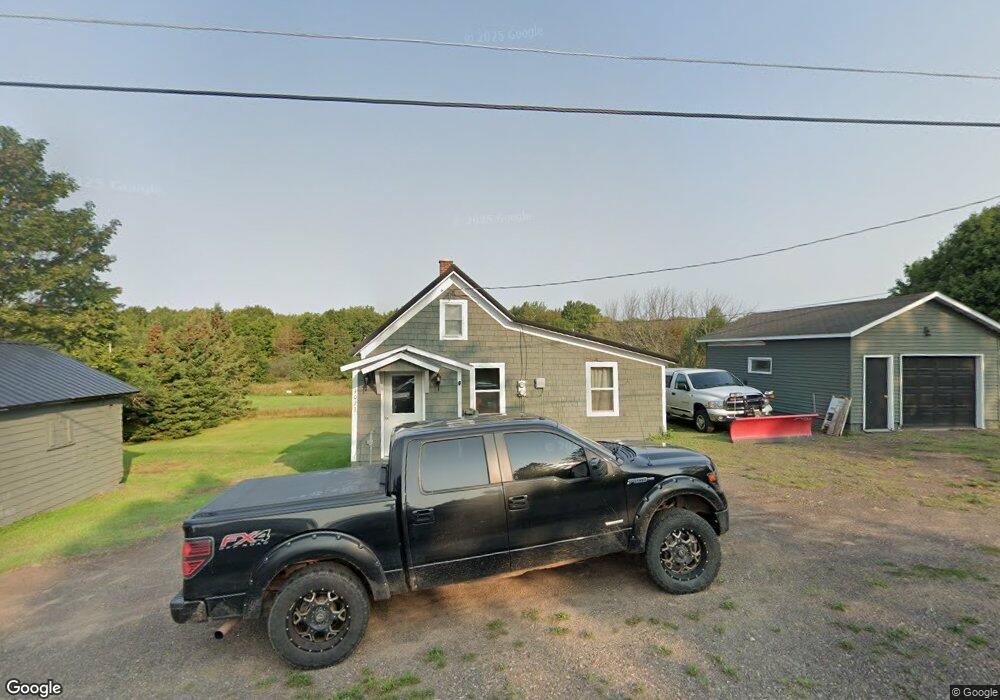
1023 Ahmeek St Mohawk, MI 49950
Estimated Value: $60,991 - $106,000
Studio
1
Bath
812
Sq Ft
$111/Sq Ft
Est. Value
About This Home
This home is located at 1023 Ahmeek St, Mohawk, MI 49950 and is currently estimated at $89,748, approximately $110 per square foot. 1023 Ahmeek St is a home with nearby schools including C.L.K. Elementary School, Washington Middle School, and Horizons Alternative High School.
Ownership History
Date
Name
Owned For
Owner Type
Purchase Details
Closed on
Oct 18, 2019
Sold by
Julie Luginbill
Bought by
Brett Randell
Current Estimated Value
Create a Home Valuation Report for This Property
The Home Valuation Report is an in-depth analysis detailing your home's value as well as a comparison with similar homes in the area
Purchase History
| Date | Buyer | Sale Price | Title Company |
|---|---|---|---|
| Brett Randell | $30,000 | -- |
Source: Public Records
Tax History
| Year | Tax Paid | Tax Assessment Tax Assessment Total Assessment is a certain percentage of the fair market value that is determined by local assessors to be the total taxable value of land and additions on the property. | Land | Improvement |
|---|---|---|---|---|
| 2025 | $563 | $30,575 | $4,750 | $25,825 |
| 2024 | -- | $28,204 | $3,000 | $25,204 |
| 2023 | -- | $24,379 | $1,750 | $22,629 |
| 2022 | -- | $20,891 | $1,750 | $19,141 |
| 2021 | $0 | $18,543 | $1,750 | $16,793 |
Source: Public Records
Map
Nearby Homes
- 52 Senter St
- TBD Lots 3 & 4 Duncan St
- 392 7th St
- 152 Birch St
- 59095 Church St
- TBD A Number 4 Rd
- 1021 Sedar Hill(parcel C) Rd Unit Parcel C
- 1021 Sedar Hill(parcel D) Rd Unit (Parcel D)
- 2741 Sunset Bay Beach Rd
- 57560 Waterworks St
- 51 1st St
- 205 Kearsarge St
- 237 Kearsarge St
- 25417 Elm St
- 56860 Boone Ln
- 56886 Calumet Ave
- 25220 Maple St
- 56711 Hecla St
- 415 Kearsarge St
- 56511 Laurium St
Your Personal Tour Guide
Ask me questions while you tour the home.