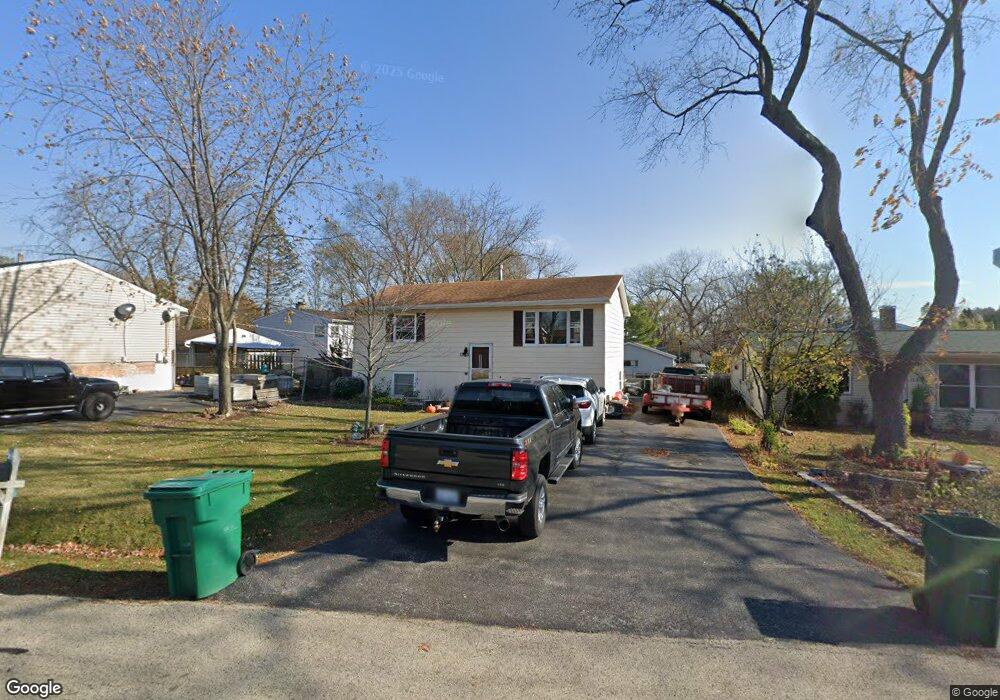
1023 Brentwood Dr Unit 2 Round Lake Beach, IL 60073
Estimated Value: $240,000 - $266,238
4
Beds
3
Baths
864
Sq Ft
$292/Sq Ft
Est. Value
About This Home
This home is located at 1023 Brentwood Dr Unit 2, Round Lake Beach, IL 60073 and is currently estimated at $252,060, approximately $291 per square foot. 1023 Brentwood Dr Unit 2 is a home located in Lake County with nearby schools including Raymond Ellis Elementary School, Round Lake Middle School, and Round Lake High School.
Ownership History
Date
Name
Owned For
Owner Type
Purchase Details
Closed on
Sep 27, 2002
Sold by
Moreno Armando
Bought by
Moreno Armando and Moreno Sandra E
Current Estimated Value
Home Financials for this Owner
Home Financials are based on the most recent Mortgage that was taken out on this home.
Original Mortgage
$117,200
Interest Rate
6.08%
Purchase Details
Closed on
Mar 20, 1998
Sold by
Moreno Armando and Contreras Sandra E
Bought by
Moreno Armando
Home Financials for this Owner
Home Financials are based on the most recent Mortgage that was taken out on this home.
Original Mortgage
$108,900
Interest Rate
7.19%
Purchase Details
Closed on
Dec 4, 1995
Sold by
Hrdlicka Gerald J and Jewell Lori Jean
Bought by
Moreno Armando and Contreras Sandra E
Home Financials for this Owner
Home Financials are based on the most recent Mortgage that was taken out on this home.
Original Mortgage
$107,600
Interest Rate
7.52%
Mortgage Type
FHA
Create a Home Valuation Report for This Property
The Home Valuation Report is an in-depth analysis detailing your home's value as well as a comparison with similar homes in the area
Home Values in the Area
Average Home Value in this Area
Purchase History
| Date | Buyer | Sale Price | Title Company |
|---|---|---|---|
| Moreno Armando | -- | World Title Guaranty Inc | |
| Moreno Armando | -- | -- | |
| Moreno Armando | $99,000 | Chicago Title Insurance Co |
Source: Public Records
Mortgage History
| Date | Status | Borrower | Loan Amount |
|---|---|---|---|
| Closed | Moreno Armando | $117,200 | |
| Closed | Moreno Armando | $108,900 | |
| Closed | Moreno Armando | $107,600 |
Source: Public Records
Tax History Compared to Growth
Tax History
| Year | Tax Paid | Tax Assessment Tax Assessment Total Assessment is a certain percentage of the fair market value that is determined by local assessors to be the total taxable value of land and additions on the property. | Land | Improvement |
|---|---|---|---|---|
| 2024 | $5,362 | $72,186 | $10,057 | $62,129 |
| 2023 | $4,990 | $63,095 | $8,790 | $54,305 |
| 2022 | $4,990 | $56,211 | $7,424 | $48,787 |
| 2021 | $4,995 | $51,198 | $7,136 | $44,062 |
| 2020 | $4,774 | $48,714 | $6,790 | $41,924 |
| 2019 | $4,627 | $46,737 | $6,514 | $40,223 |
| 2018 | $4,663 | $42,025 | $6,195 | $35,830 |
| 2017 | $4,560 | $39,530 | $5,827 | $33,703 |
| 2016 | $4,356 | $36,490 | $5,379 | $31,111 |
| 2015 | $4,219 | $33,336 | $4,914 | $28,422 |
| 2014 | $4,680 | $37,410 | $4,941 | $32,469 |
| 2012 | $4,680 | $39,070 | $5,160 | $33,910 |
Source: Public Records
Map
Nearby Homes
- 905 Buena Vista Dr
- 915 Mayfield Dr
- 931 N Fairfield Rd
- 123 Nasa Cir
- 1163 N Red Oak Cir Unit 4
- 1315 Cherokee Dr
- 1110 N Fairfield Rd
- 1160 N Red Oak Cir Unit 1160-1
- 347 N Red Oak Cir Unit 406
- 1248 N Red Oak Cir Unit 2
- 1316 N Red Oak Cir Unit 2
- 1256 N Split Oak Cir
- 1506 Brentwood Dr
- 1503 Cherokee Dr
- 1376 W Split Oak Cir
- 922 Idlewild Dr
- 1221 N Village Dr
- 630 Morningside Dr
- 24513 W Stub Ave
- 1443 Spring Brook Ct Unit 1C
- 1021 Brentwood Dr
- 1025 Brentwood Dr
- 902 Mayfield Dr
- 901 Buena Vista Dr
- 1022 Brentwood Dr
- 1024 Brentwood Dr
- 910 Mayfield Dr
- 821 Buena Vista Dr
- 1026 Brentwood Dr
- 820 Mayfield Dr
- 1028 Brentwood Dr
- 1013 Brentwood Dr Unit 2
- 903 Mayfield Dr
- 906 Buena Vista Dr
- 901 Mayfield Dr
- 1030 Brentwood Dr
- 821 Mayfield Dr
- 909 Mayfield Dr
- 1023 Crescent Ct
- 818 Mayfield Dr