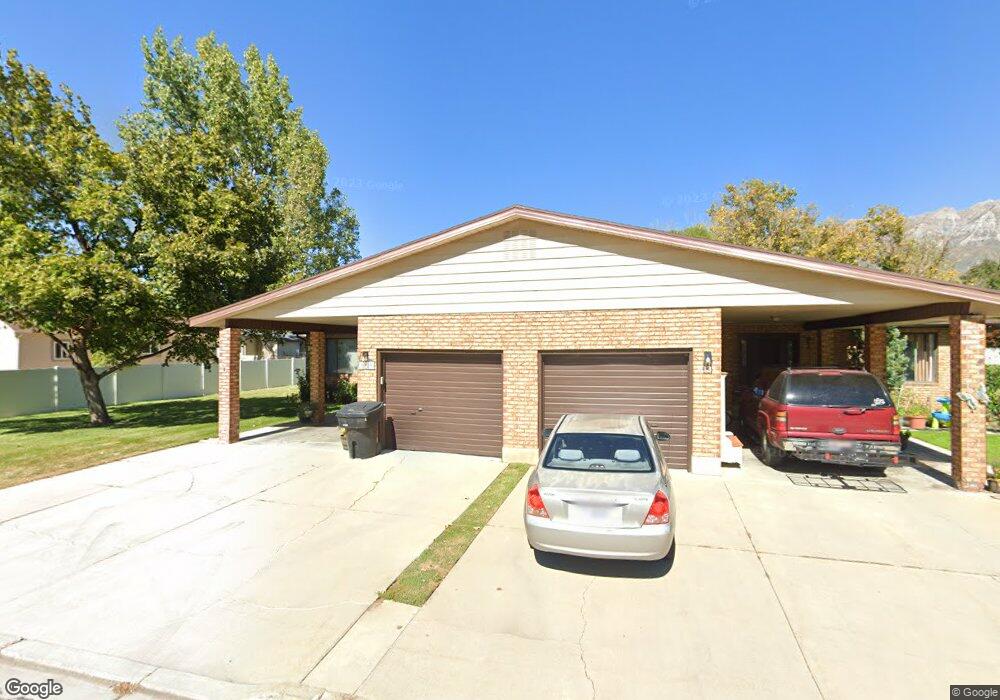
1023 E 120 N Orem, UT 84097
Cascade NeighborhoodEstimated Value: $466,000 - $515,000
4
Beds
3
Baths
2,750
Sq Ft
$178/Sq Ft
Est. Value
About This Home
This home is located at 1023 E 120 N, Orem, UT 84097 and is currently estimated at $489,896, approximately $178 per square foot. 1023 E 120 N is a home located in Utah County with nearby schools including Cascade Elementary School, Canyon View Junior High School, and Orem High School.
Ownership History
Date
Name
Owned For
Owner Type
Purchase Details
Closed on
Aug 22, 2018
Sold by
Crook Sweat Lavar H and Crook Sweat Mary Evaline
Bought by
Morgan Wendy R
Current Estimated Value
Home Financials for this Owner
Home Financials are based on the most recent Mortgage that was taken out on this home.
Original Mortgage
$207,750
Outstanding Balance
$180,422
Interest Rate
4.5%
Mortgage Type
New Conventional
Estimated Equity
$309,474
Purchase Details
Closed on
Sep 5, 2017
Sold by
Sweat Lavar and Sweat Mary
Bought by
Sweat Lavar H and Sweat Mary Evaline Crook
Purchase Details
Closed on
Jul 2, 2007
Sold by
Wakefield Donald E and Wakefield Jann B
Bought by
Sweat Lavar and Sweat Mary
Purchase Details
Closed on
Mar 18, 2005
Sold by
Brown June Greer
Bought by
Brown June Greer and Brown Burke R
Create a Home Valuation Report for This Property
The Home Valuation Report is an in-depth analysis detailing your home's value as well as a comparison with similar homes in the area
Home Values in the Area
Average Home Value in this Area
Purchase History
| Date | Buyer | Sale Price | Title Company |
|---|---|---|---|
| Morgan Wendy R | -- | Vanguard Title Ins Agency Ll | |
| Sweat Lavar H | -- | None Available | |
| Sweat Lavar | -- | Equity Title Heber City | |
| Brown June Greer | -- | -- |
Source: Public Records
Mortgage History
| Date | Status | Borrower | Loan Amount |
|---|---|---|---|
| Open | Morgan Wendy R | $207,750 |
Source: Public Records
Tax History
| Year | Tax Paid | Tax Assessment Tax Assessment Total Assessment is a certain percentage of the fair market value that is determined by local assessors to be the total taxable value of land and additions on the property. | Land | Improvement |
|---|---|---|---|---|
| 2025 | $1,992 | $234,850 | -- | -- |
| 2024 | $1,992 | $243,595 | $0 | $0 |
| 2023 | $1,732 | $227,645 | $0 | $0 |
| 2022 | $1,668 | $212,355 | $0 | $0 |
| 2021 | $1,570 | $302,800 | $36,300 | $266,500 |
| 2020 | $1,427 | $270,400 | $32,400 | $238,000 |
| 2019 | $1,319 | $260,000 | $33,000 | $227,000 |
| 2018 | $1,203 | $226,500 | $27,500 | $199,000 |
| 2017 | $1,123 | $113,245 | $0 | $0 |
| 2016 | $1,107 | $102,960 | $0 | $0 |
| 2015 | -- | $99,000 | $0 | $0 |
| 2014 | $990 | $86,680 | $0 | $0 |
Source: Public Records
Map
Nearby Homes
Your Personal Tour Guide
Ask me questions while you tour the home.